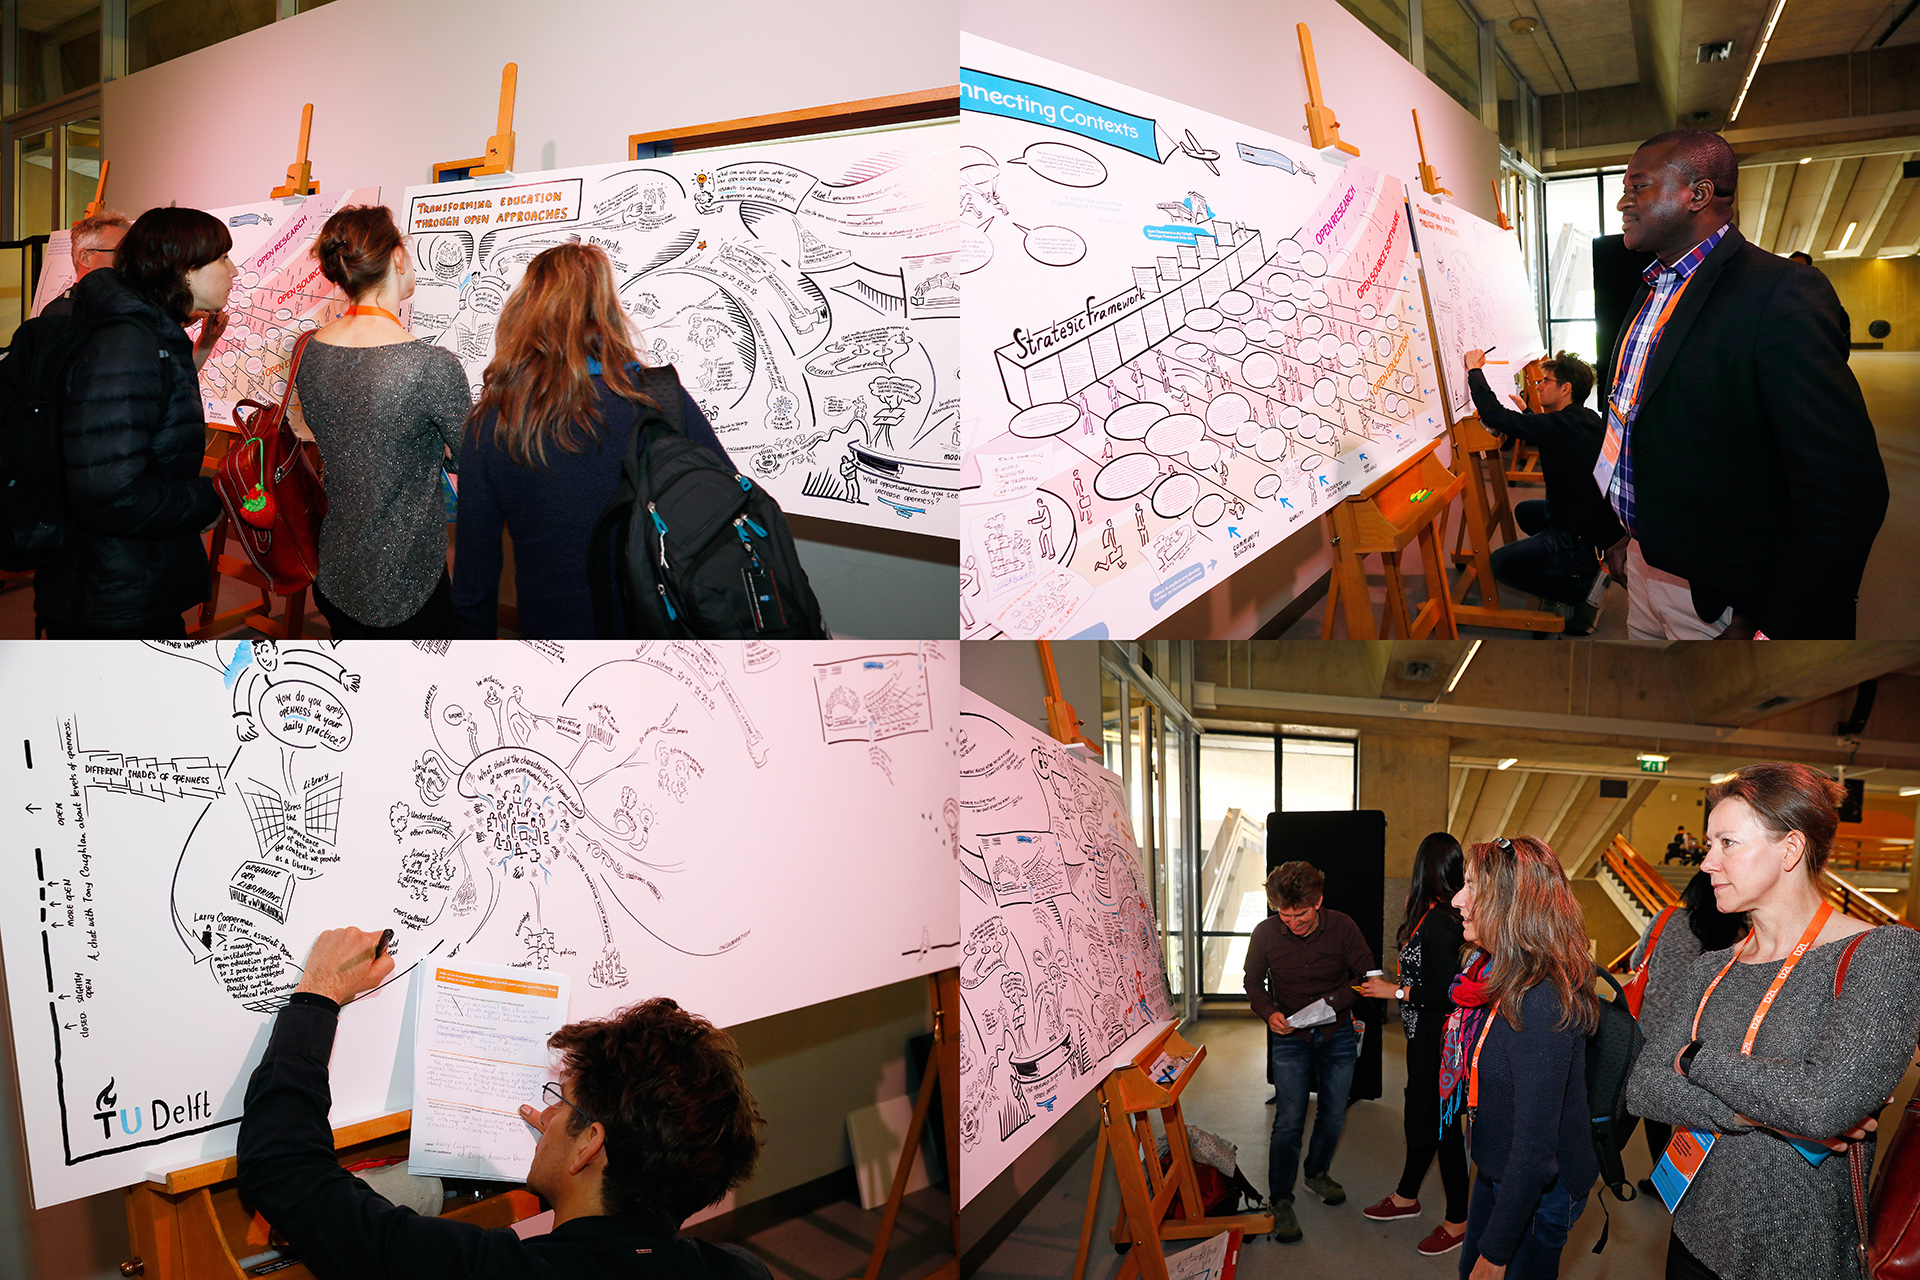
 Visualizing feedback from the OE Global participants (photos by Roy Borghouts, CC-BY OEC/TU Delft)
OPEN SCIENCE PROGRAM
In 2016 TU Delft started a university wide Open Science program, aiming at providing an umbrella for open education, open research, open data, open access publications and open source software.
In the TU Delft Year of Open 2017 Martijn and Mark visited presentations, organized events and created visualizations, looking for connections between (open) education, (open) research and (open source) software. The process and results of this quest were presented at the OE Global Conference and are shown below.
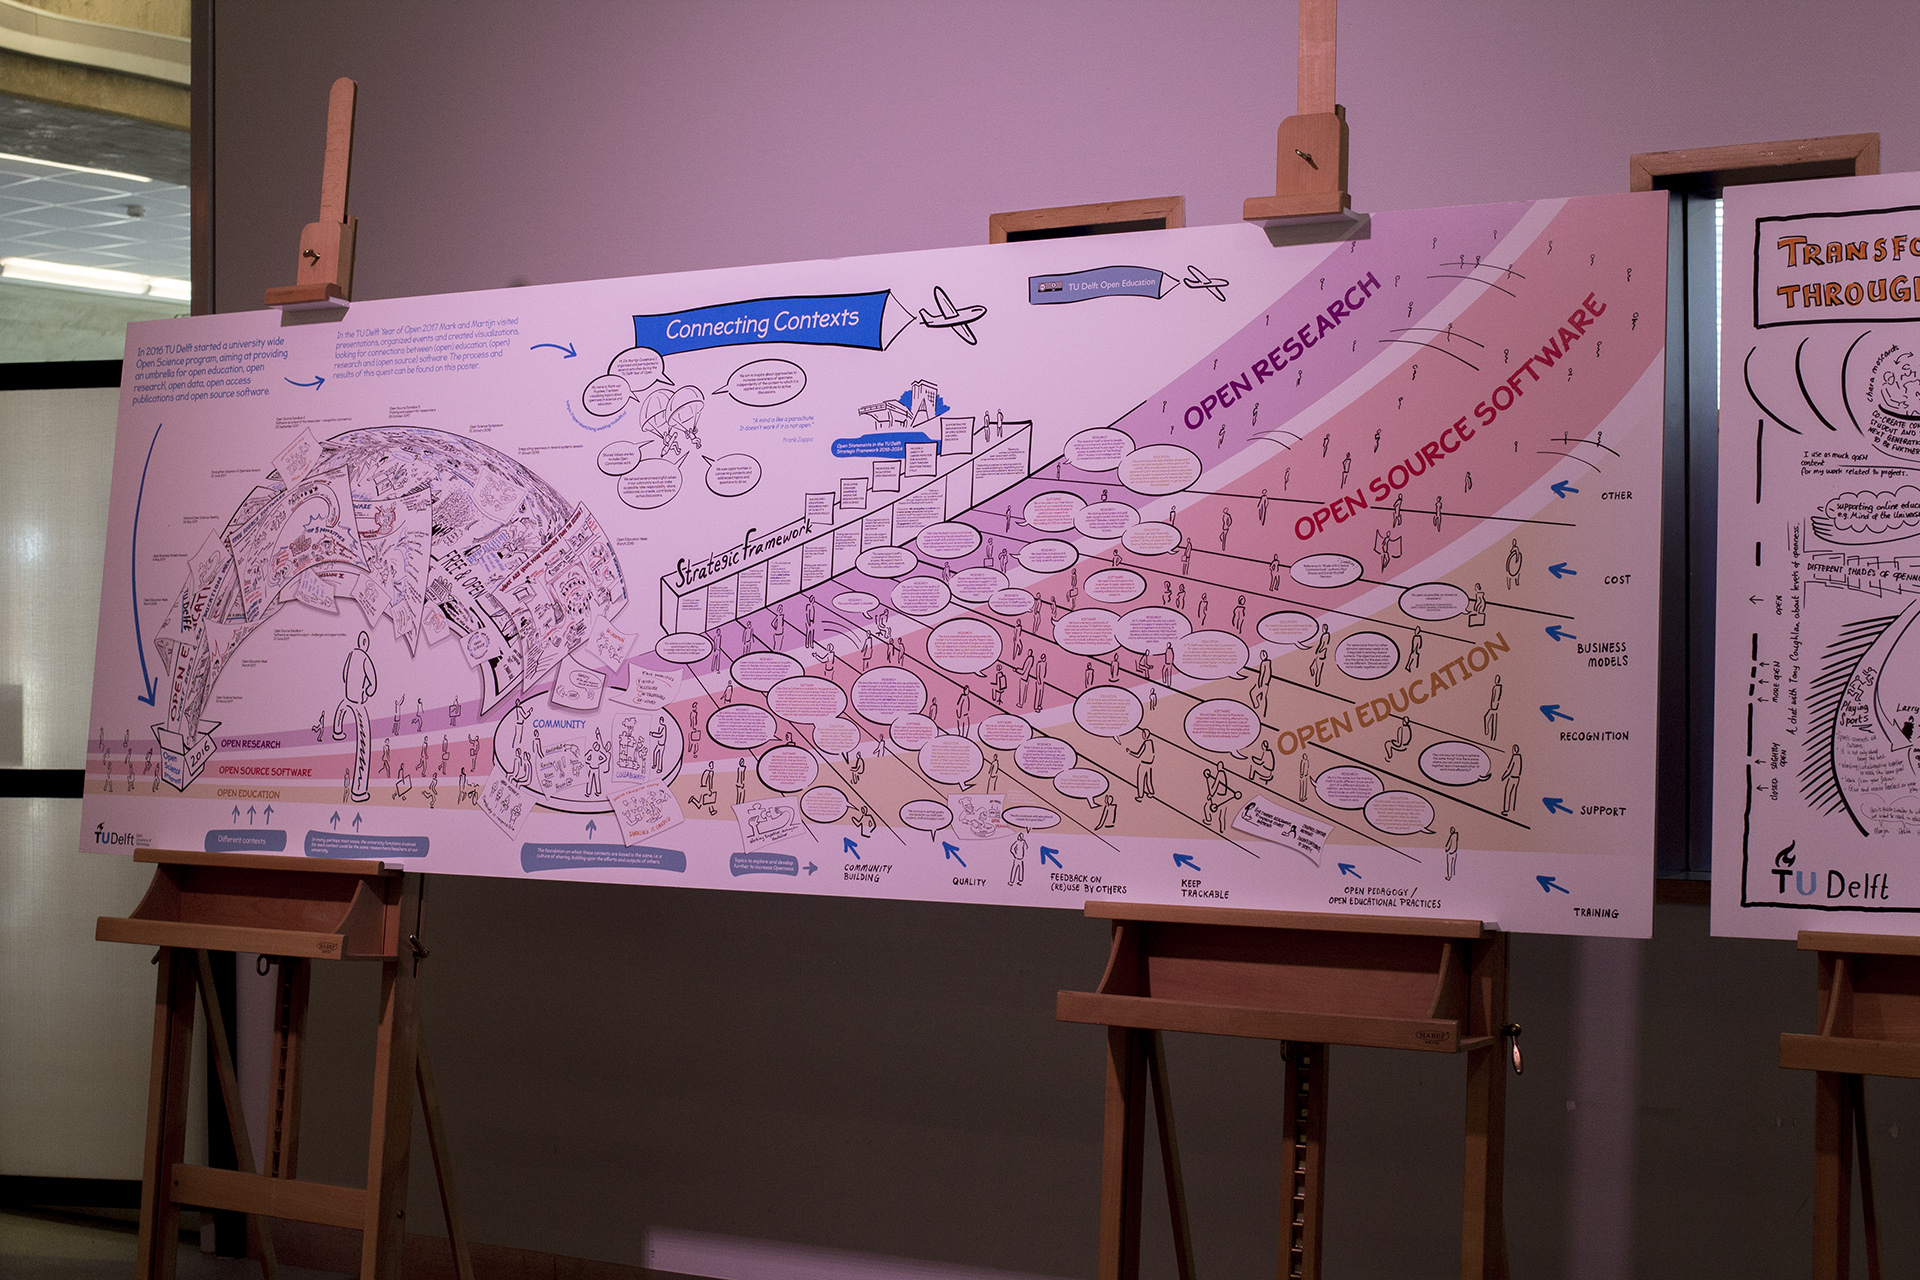
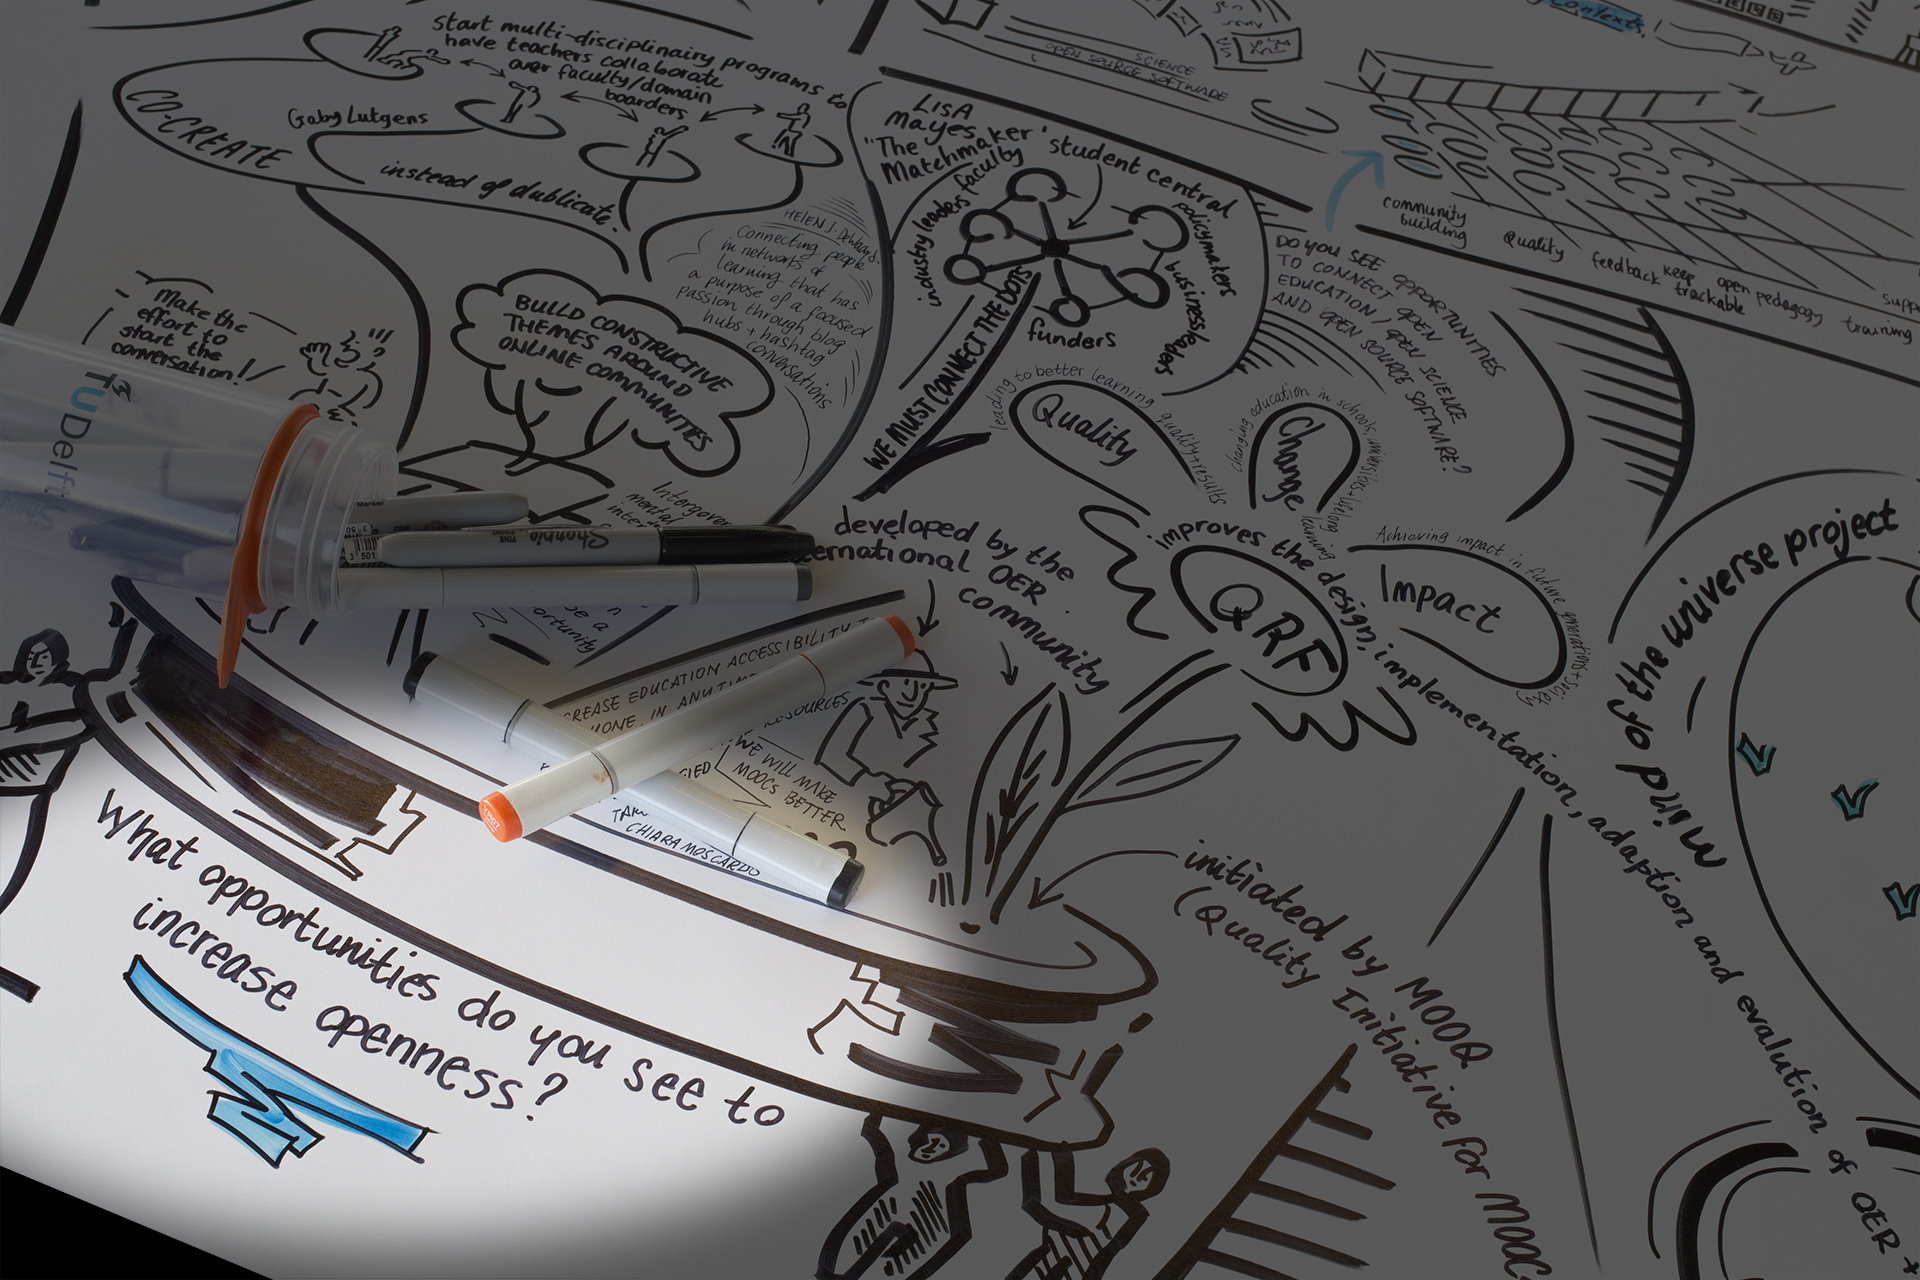
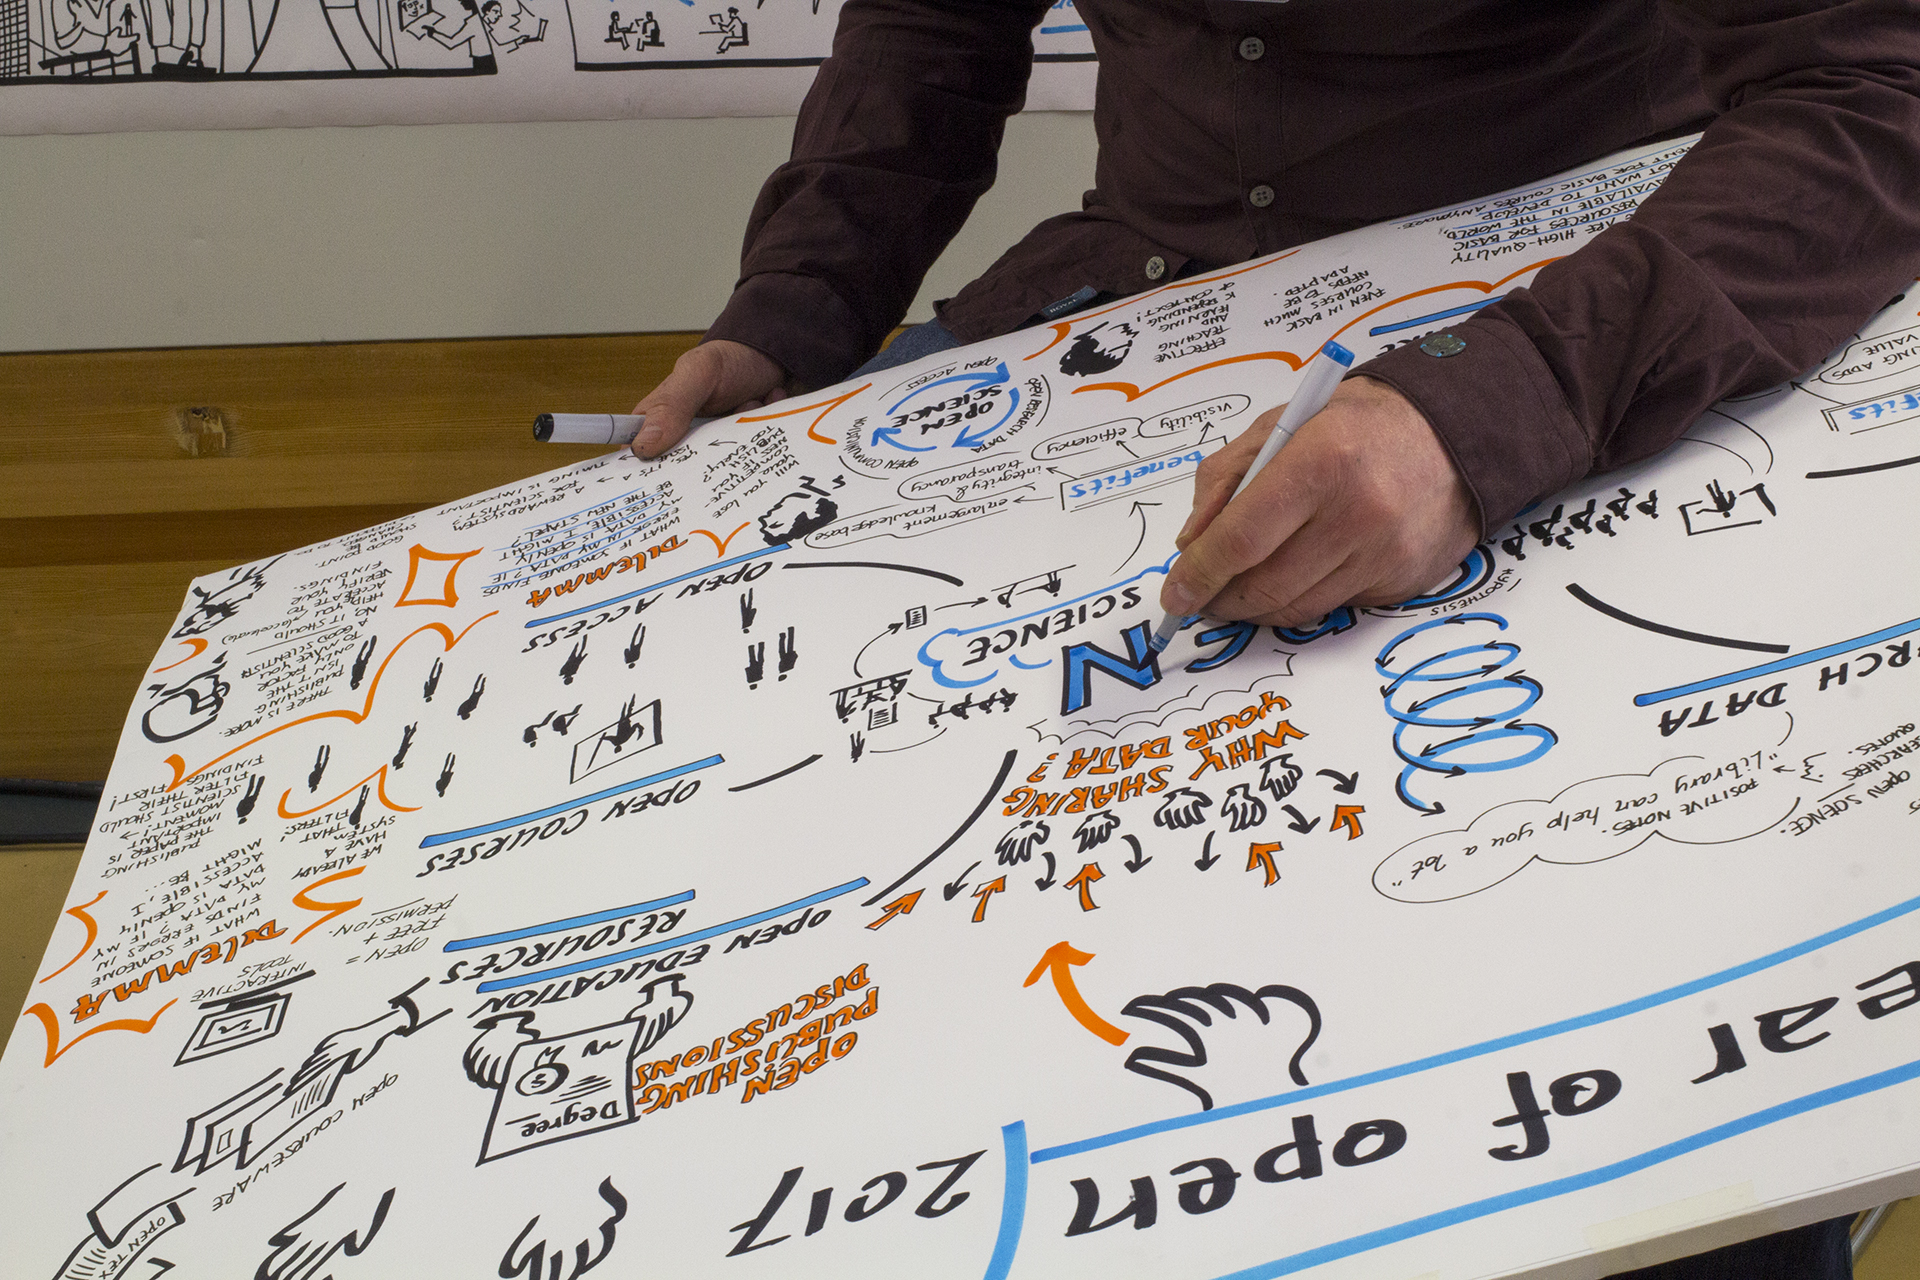
Process and results visualized on the ‘Connecting Contexts’ poster.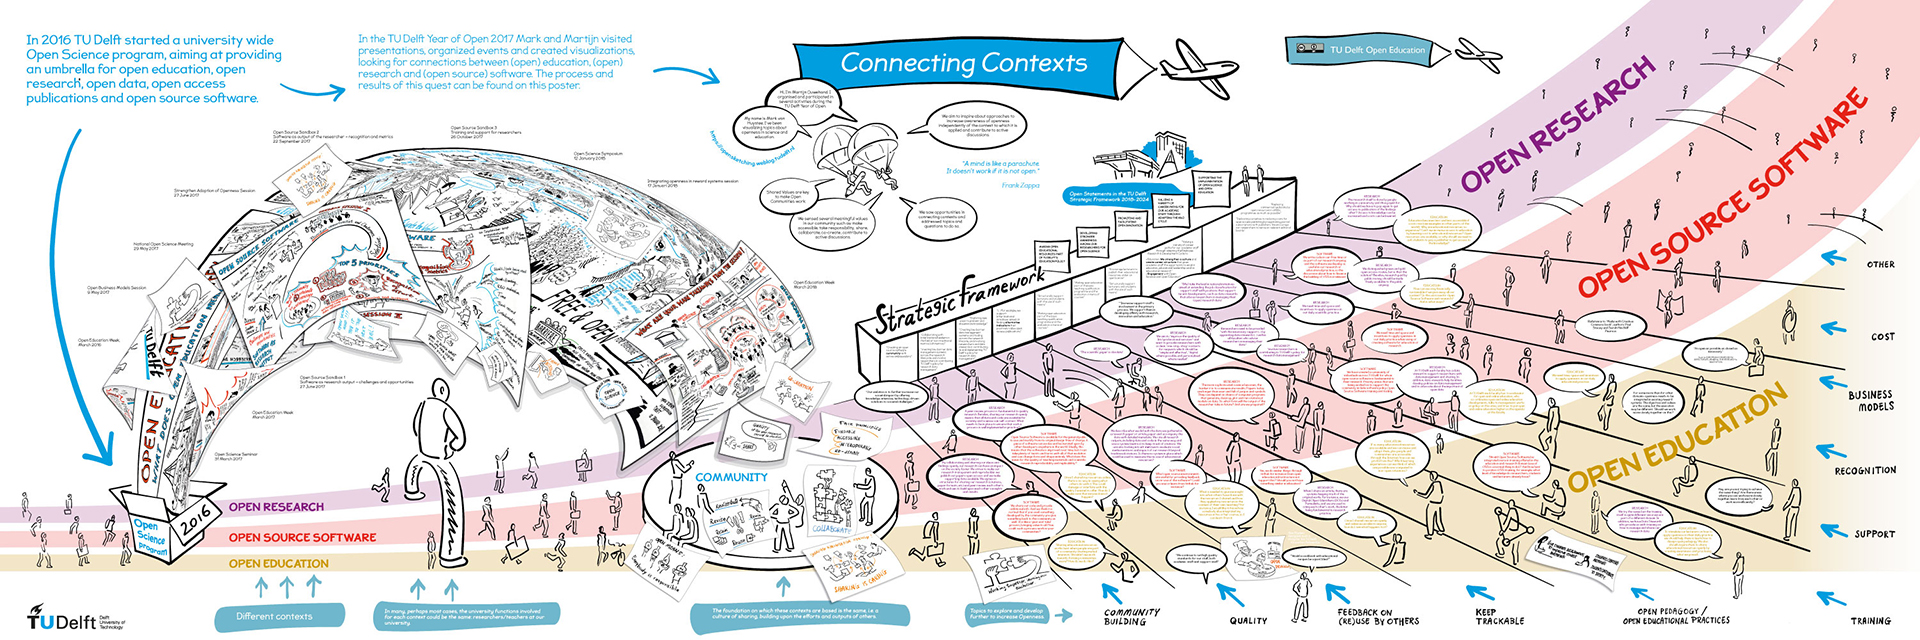
Send an email to Mark (m.t.m.vanhuystee@tudelft.nl) if you’re interested in a high resolution pdf file of the visualization.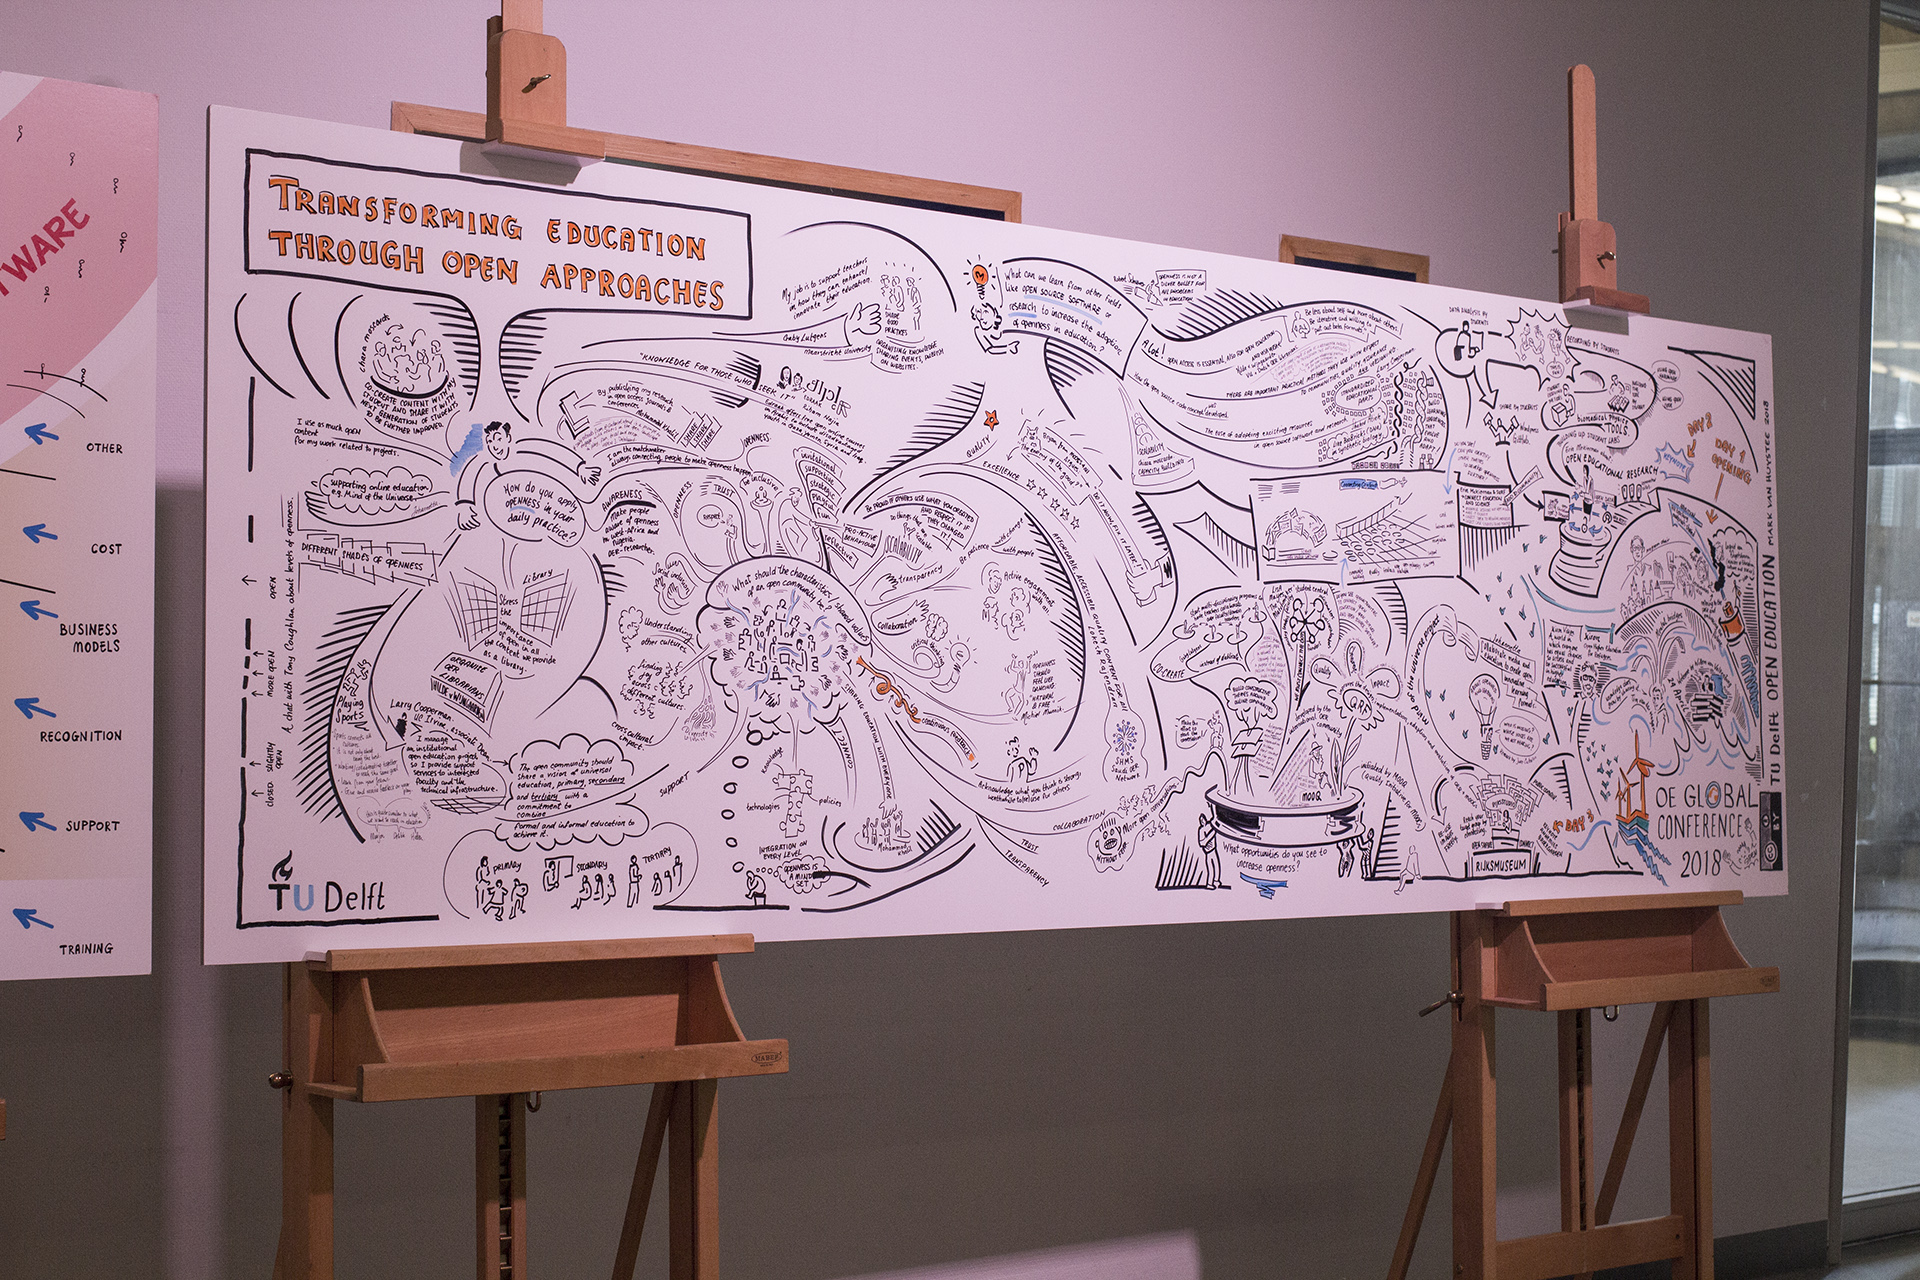 Live visualization of participants feedback at OE Global.
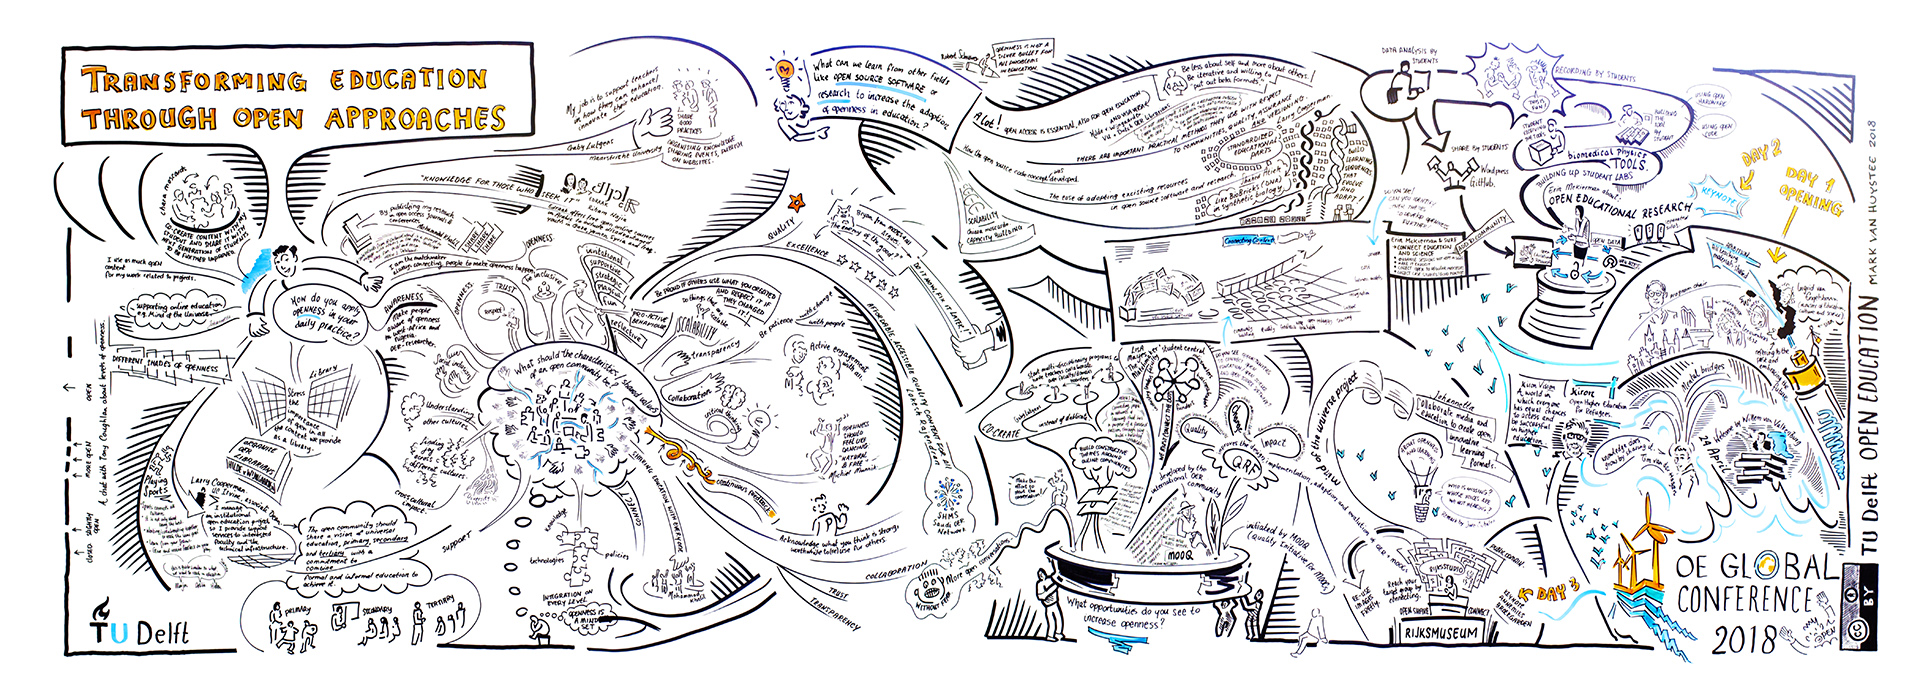 Send an email to Mark (m.t.m.vanhuystee@tudelft.nl) if you’re interested in a high resolution pdf file of this visualization.
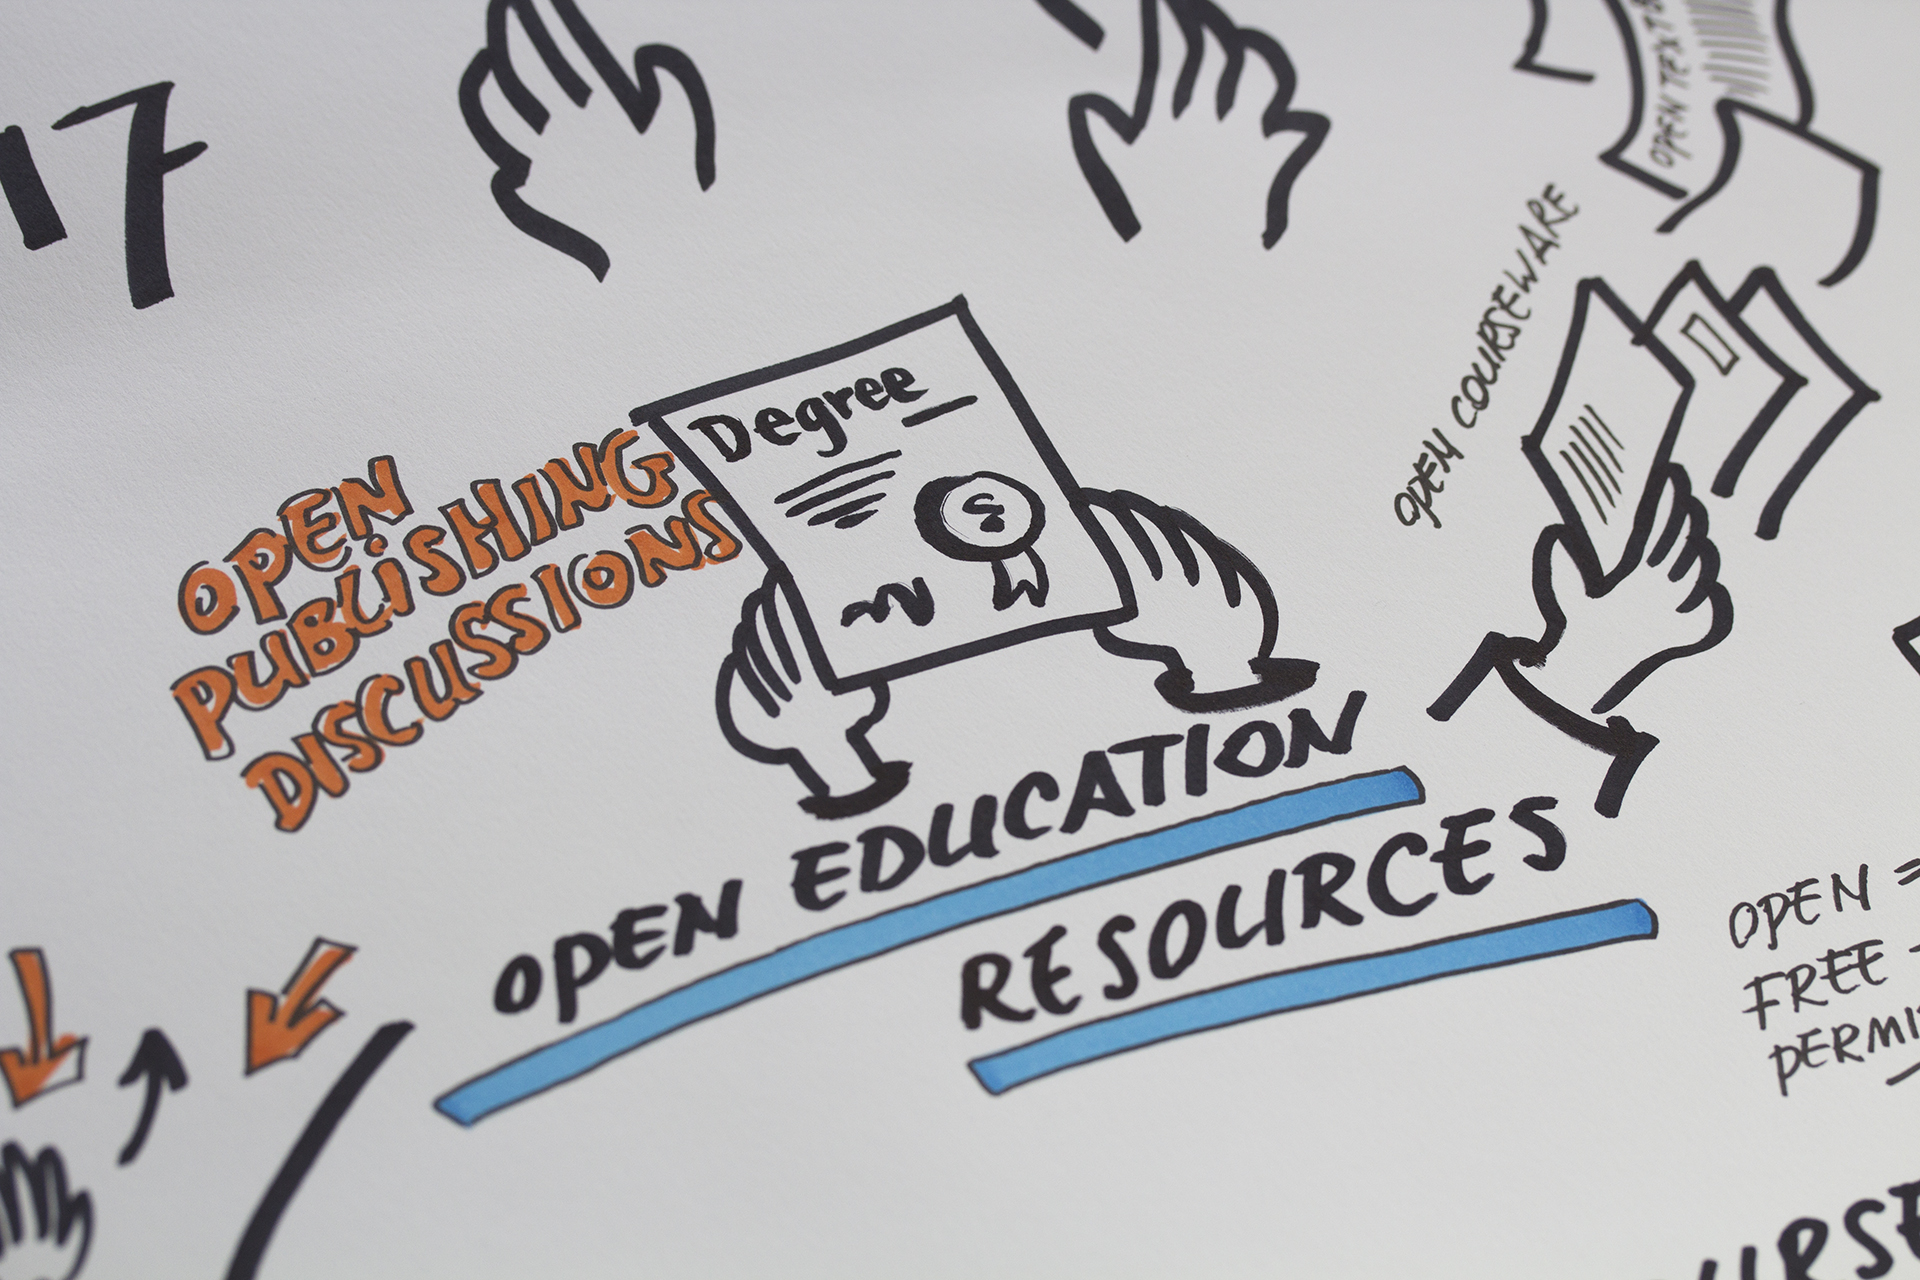
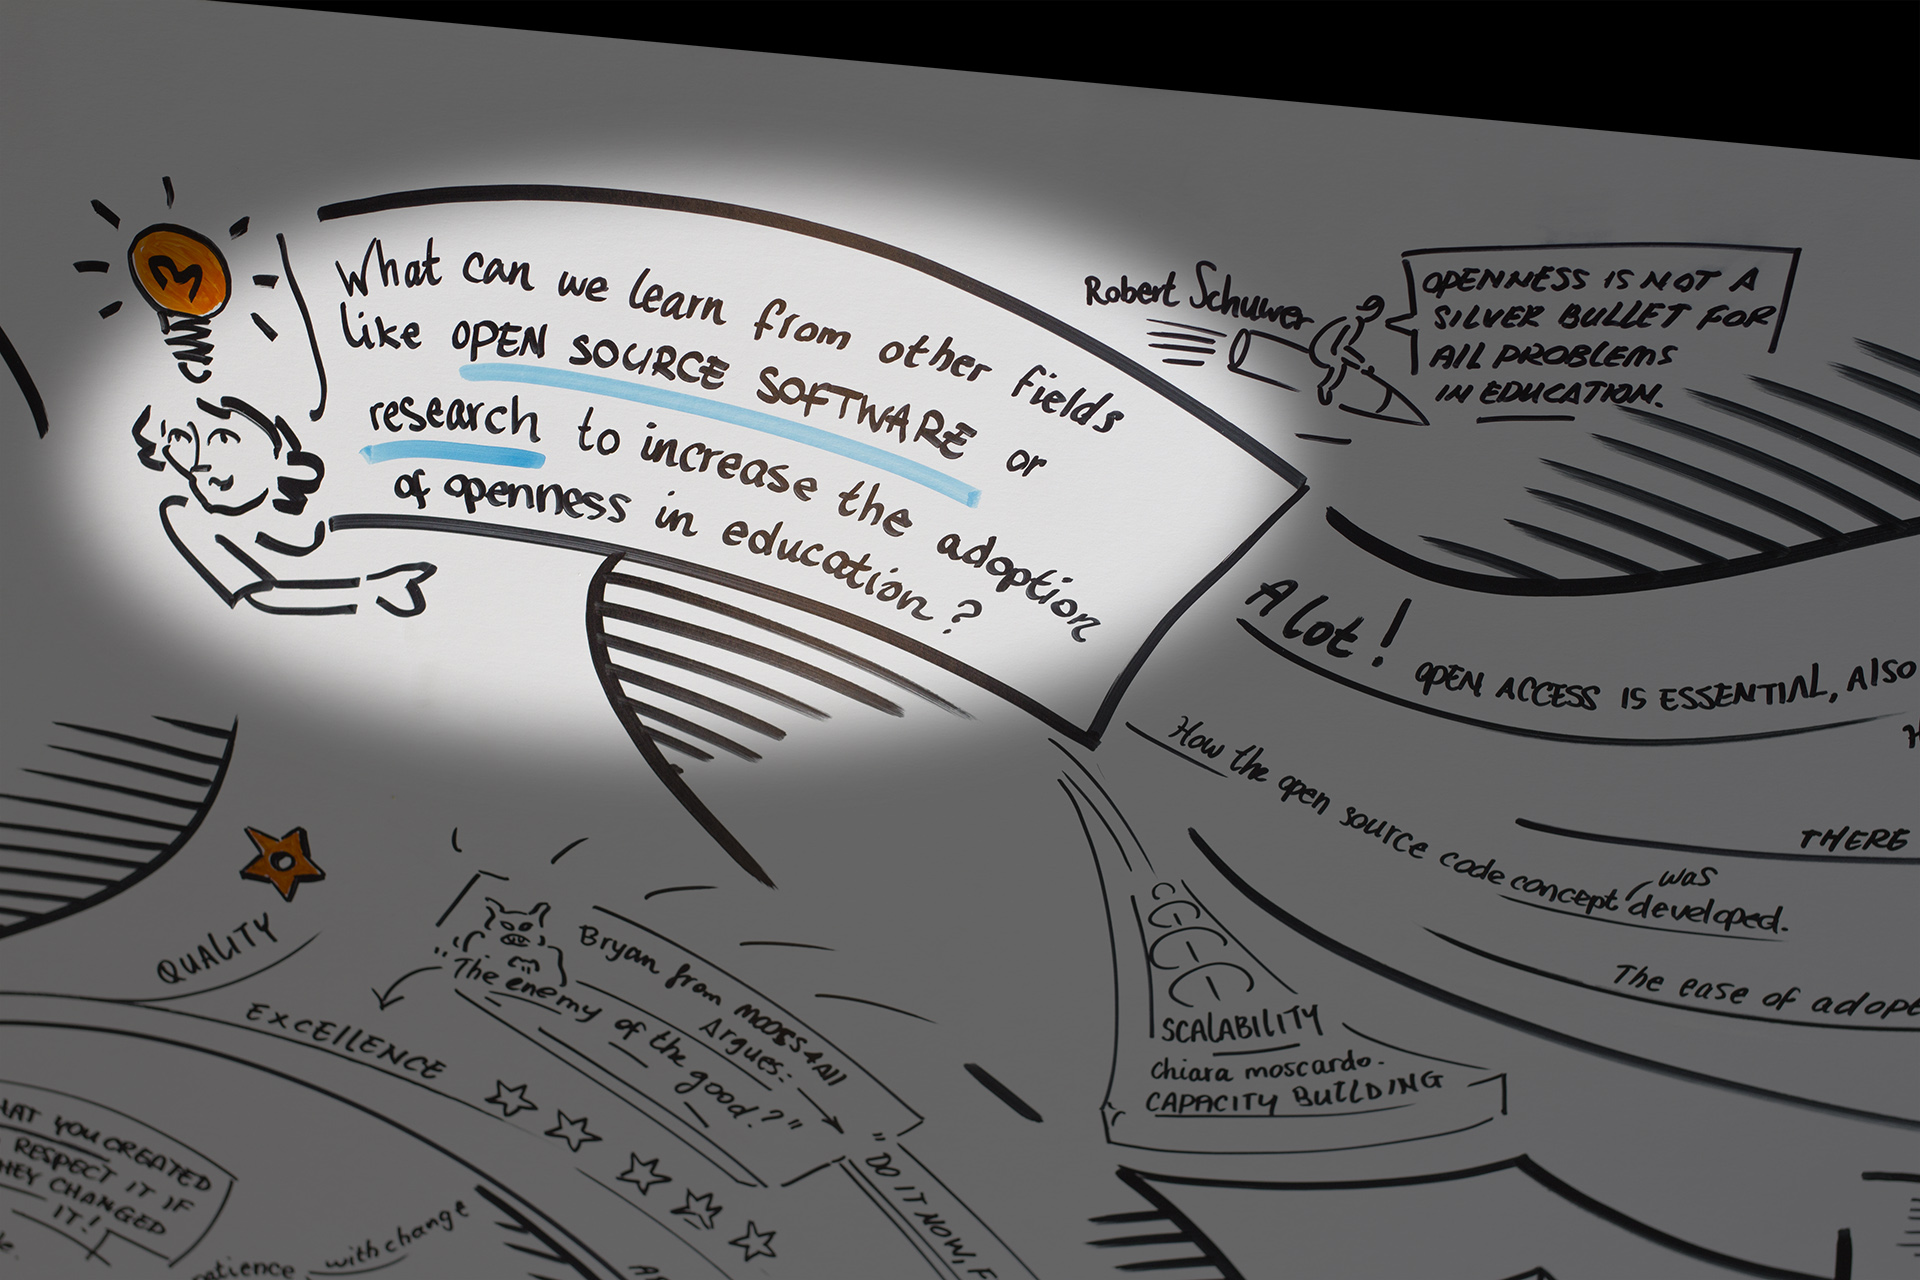
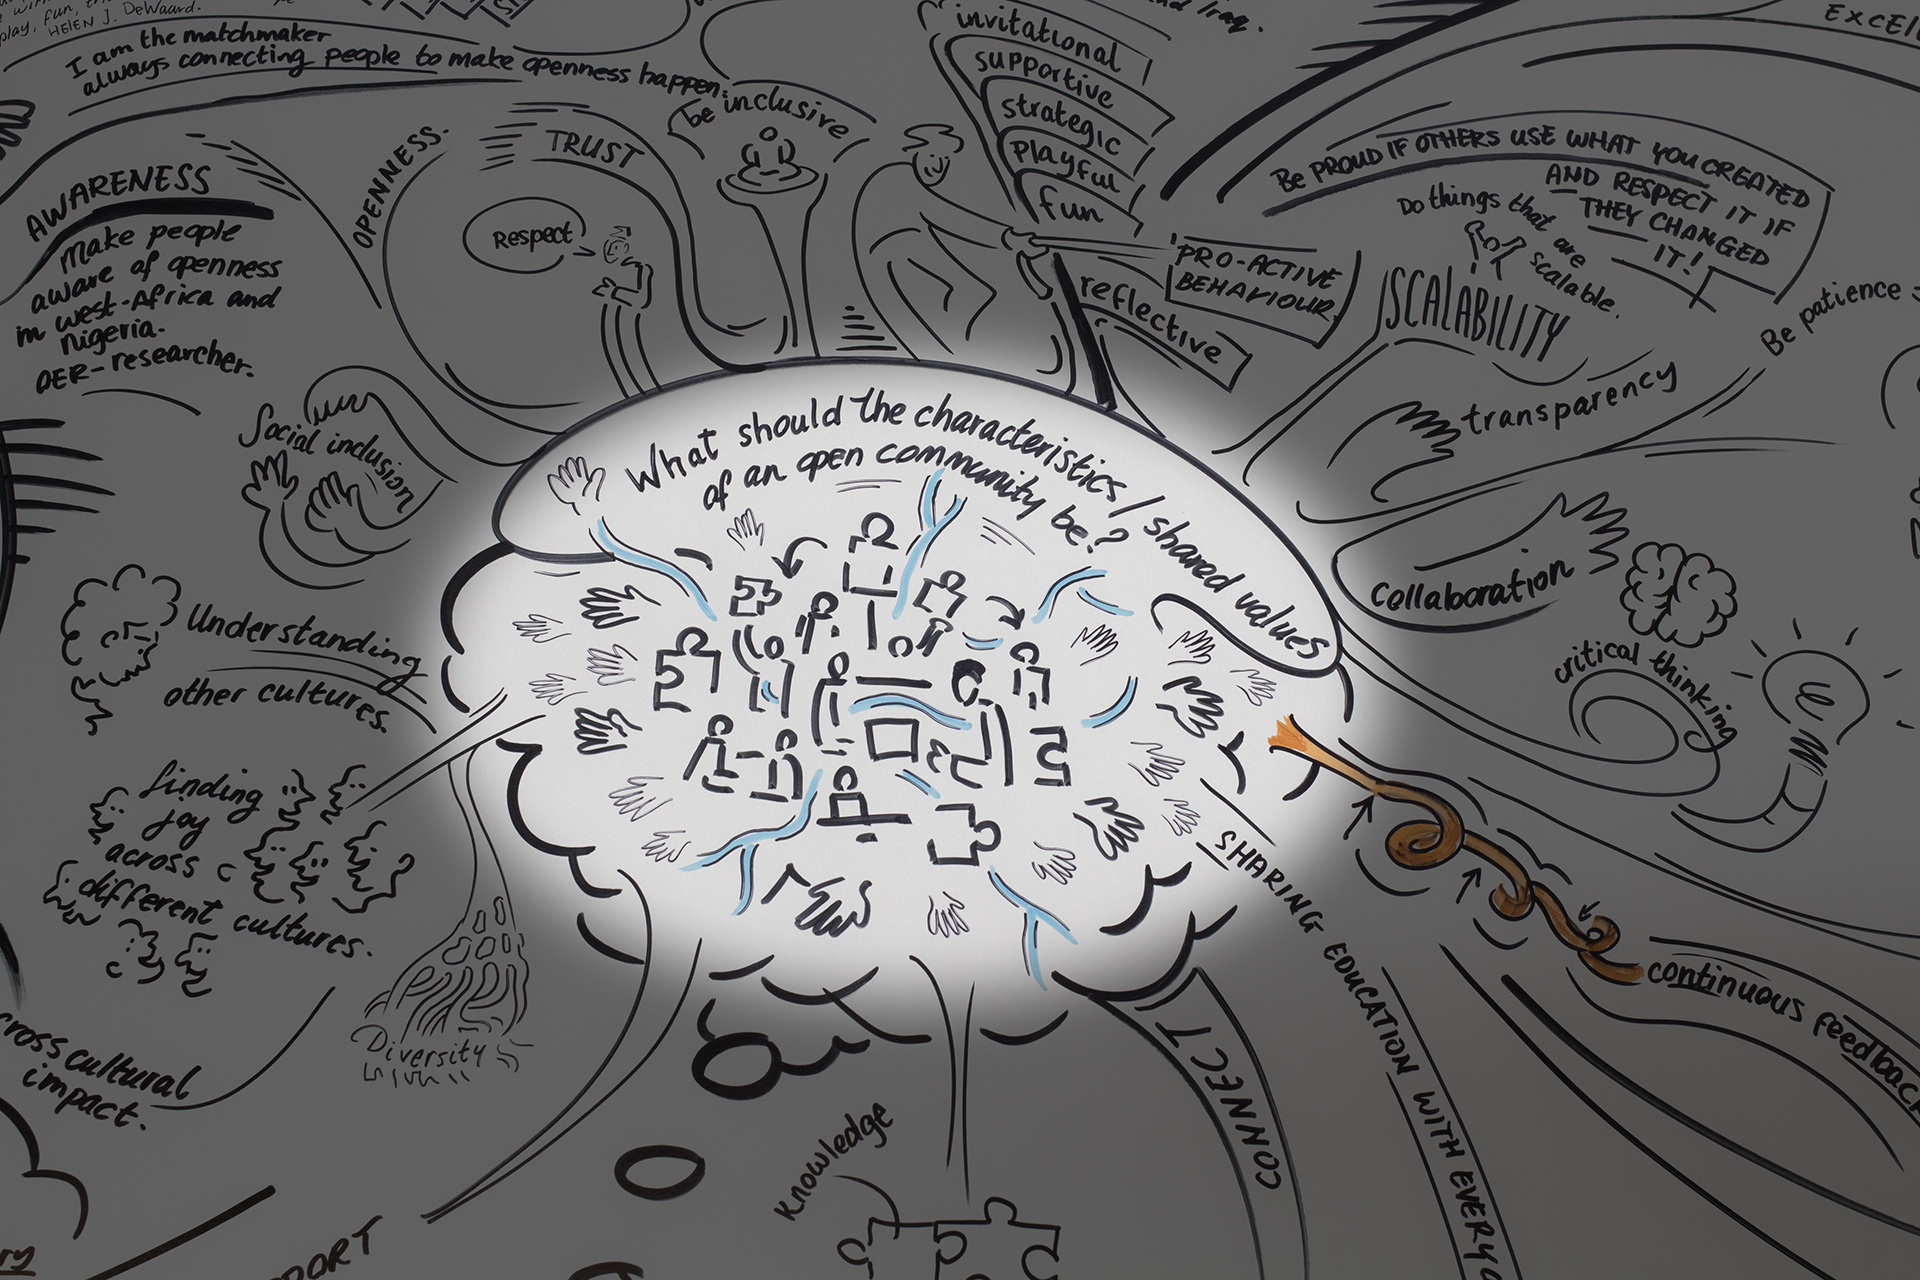
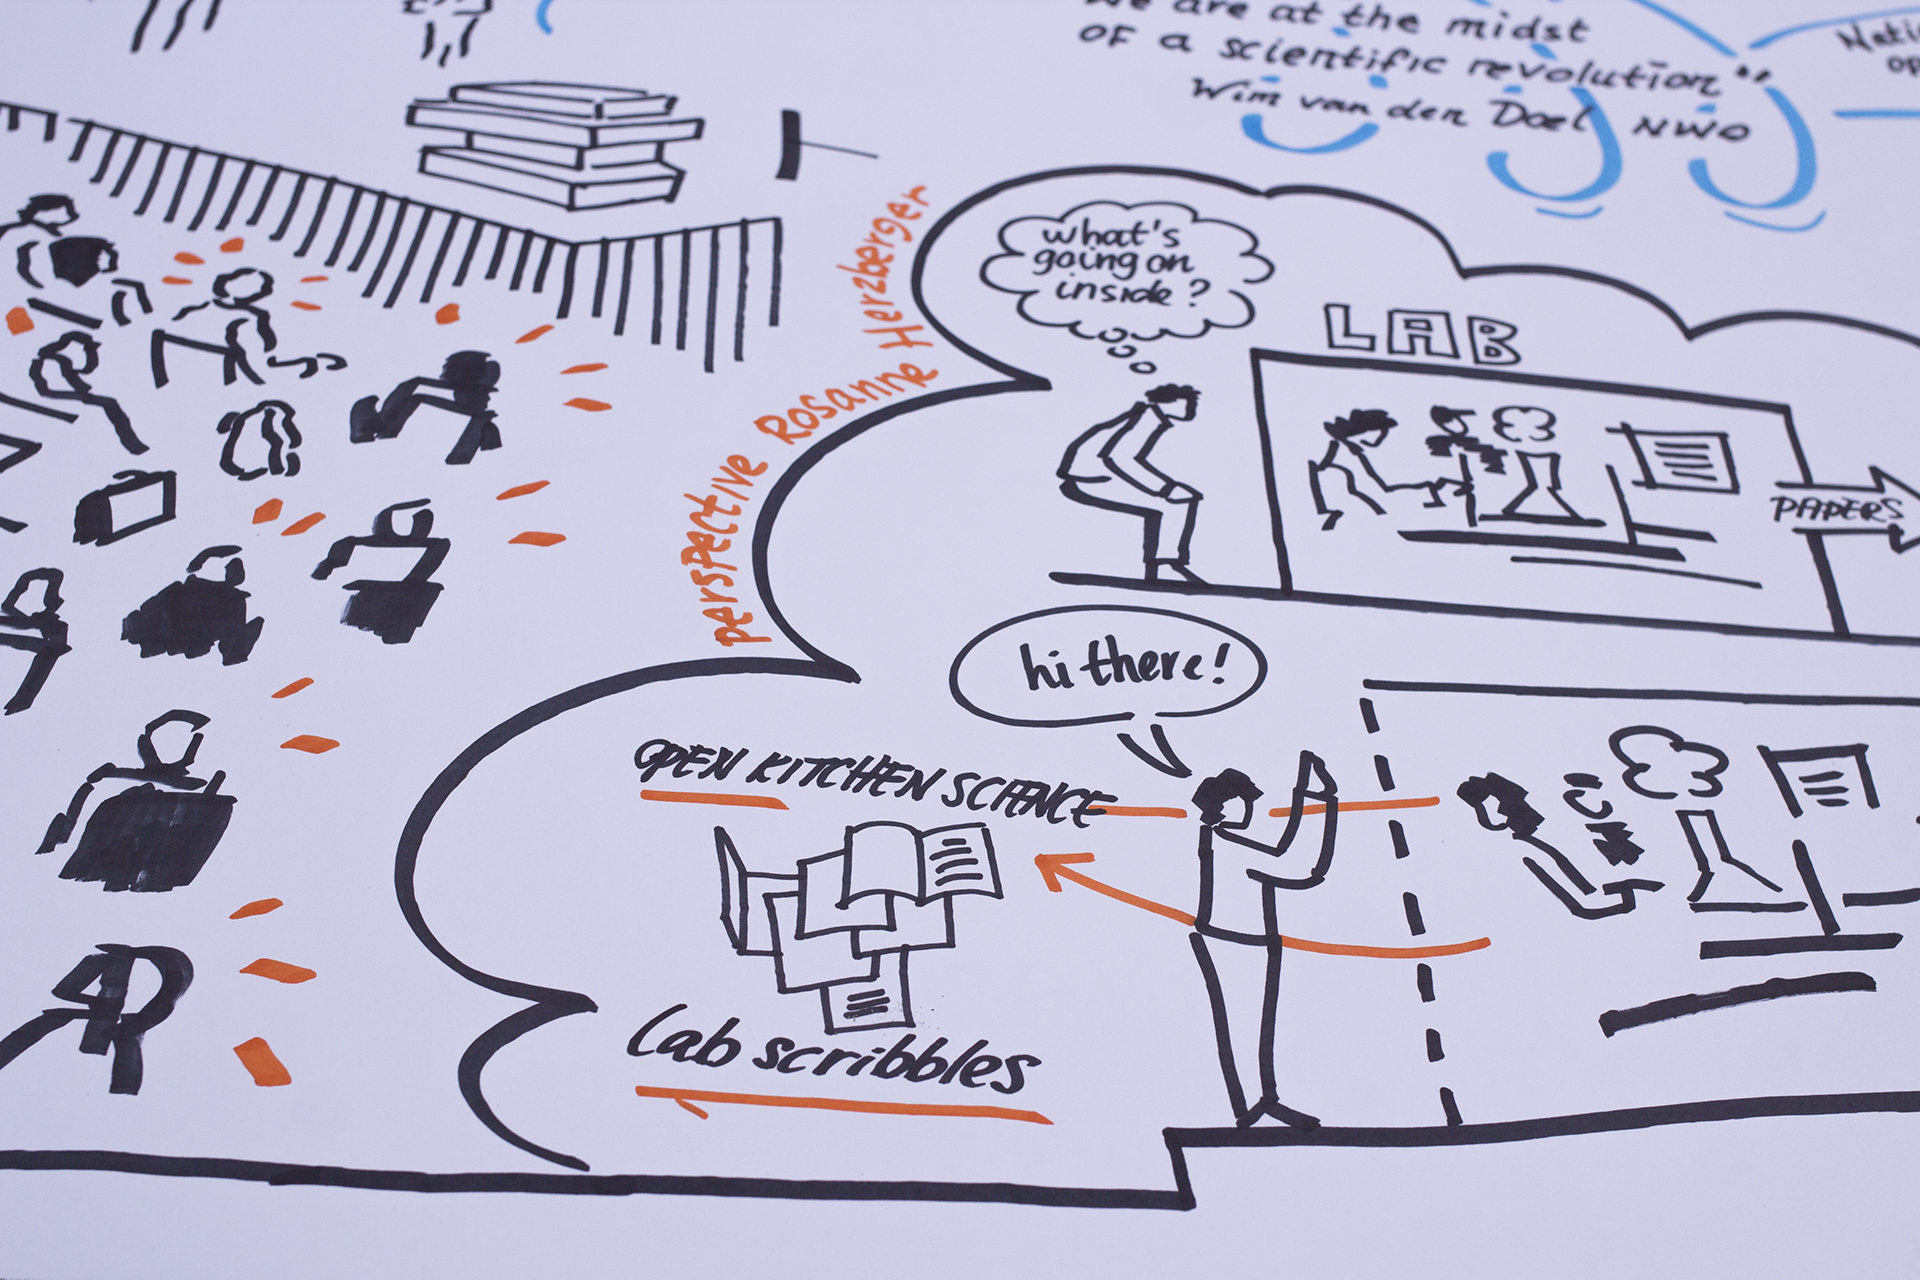
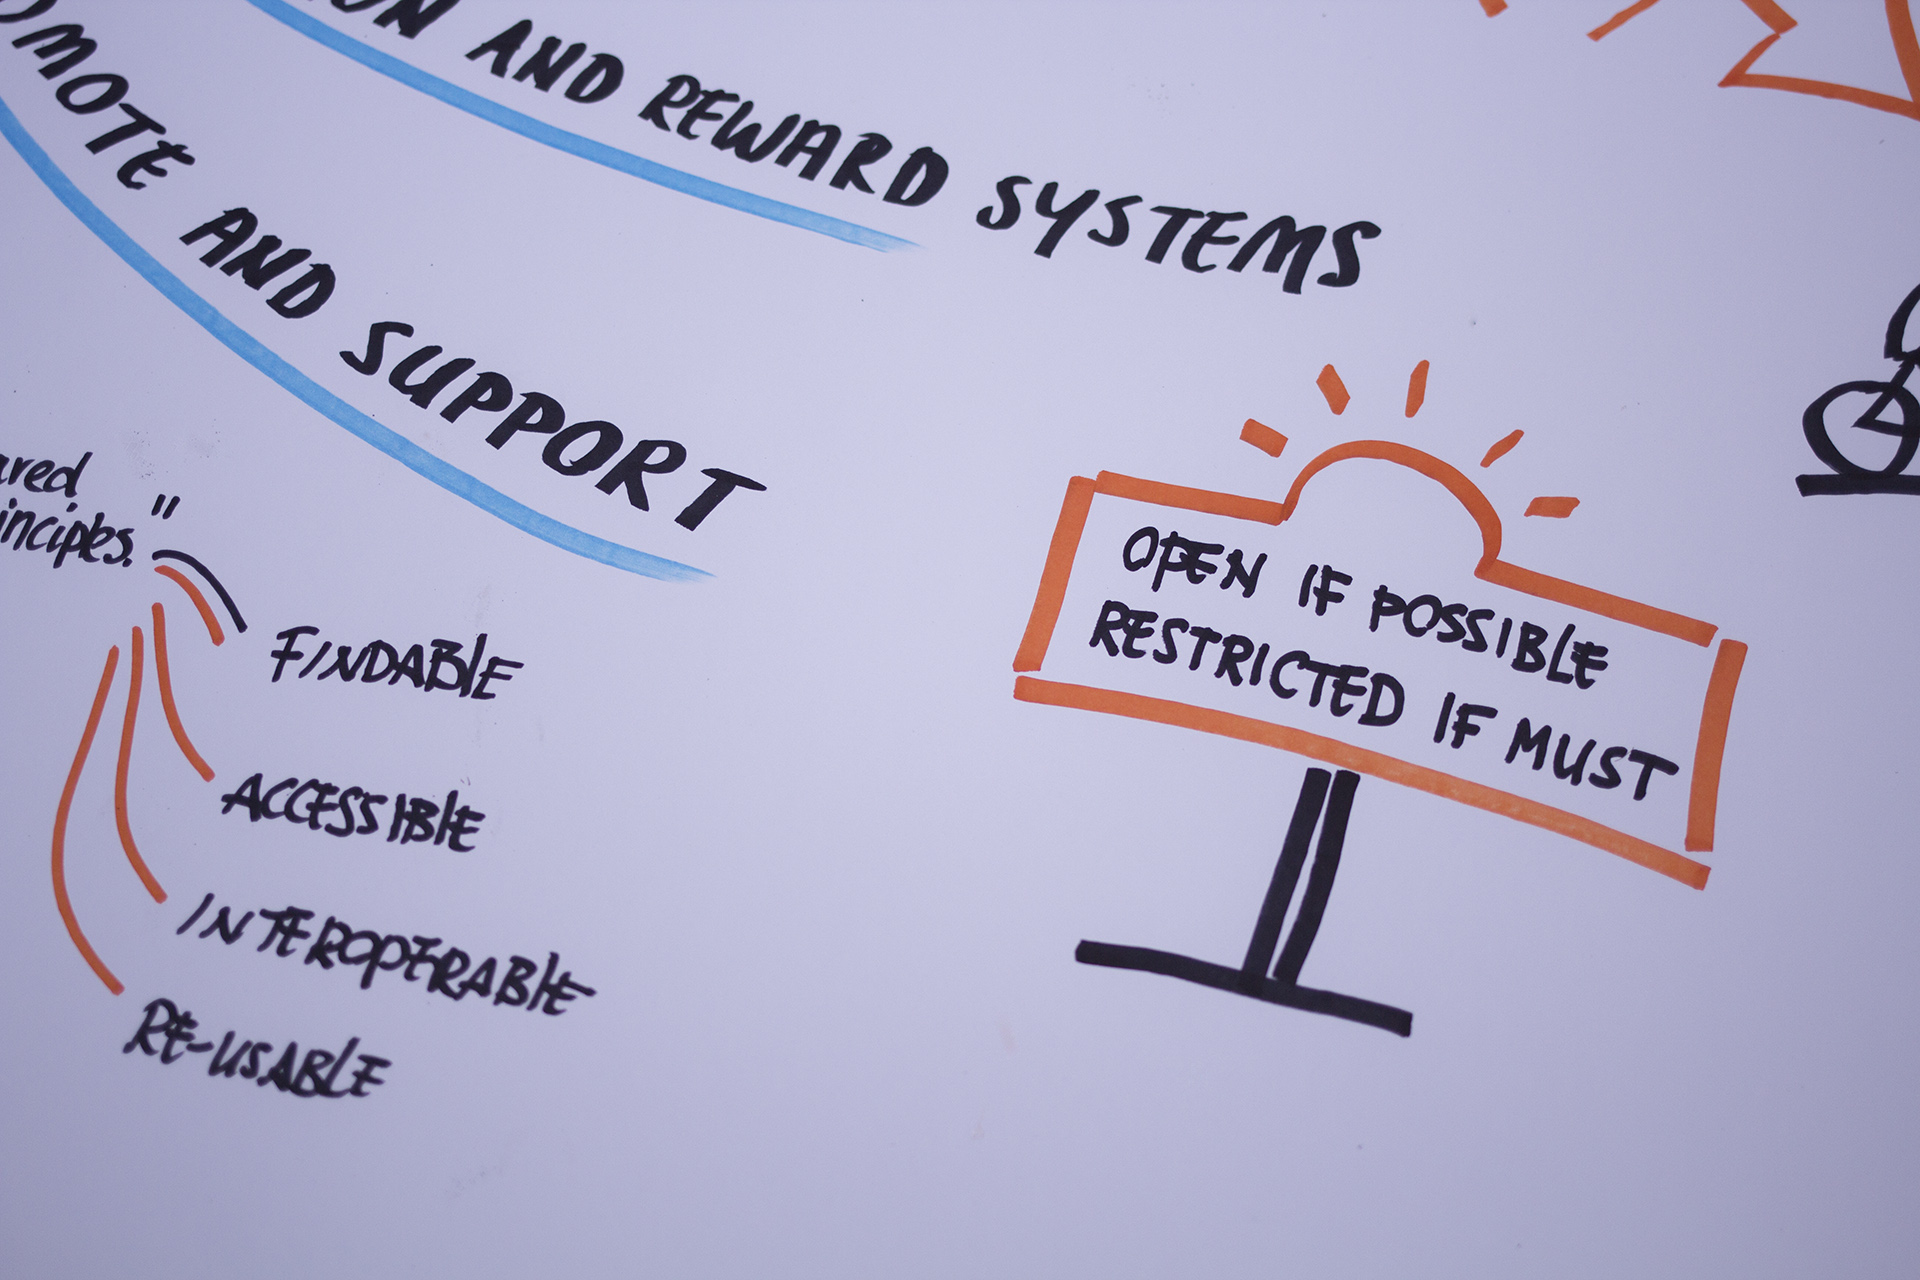
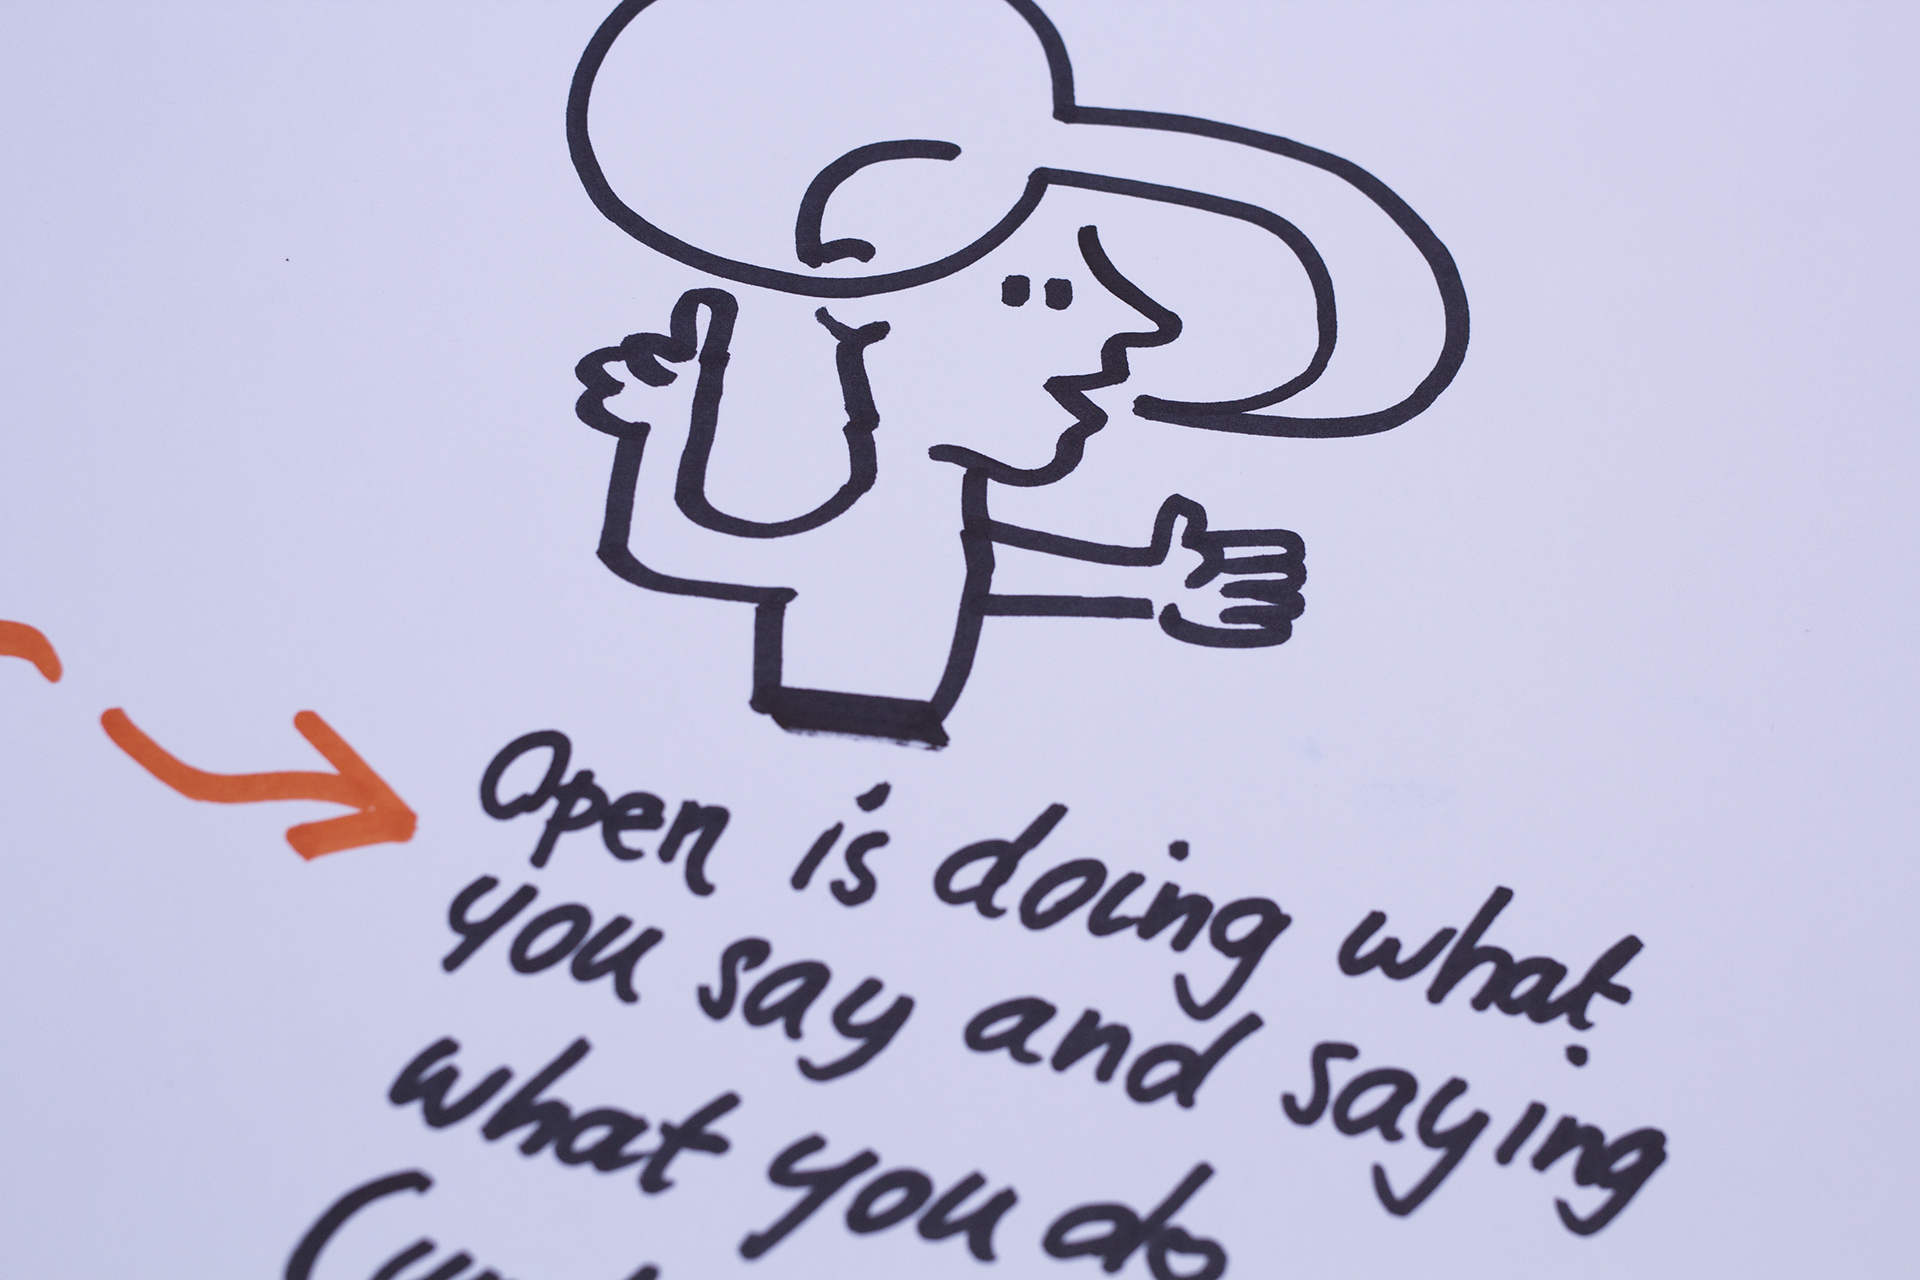
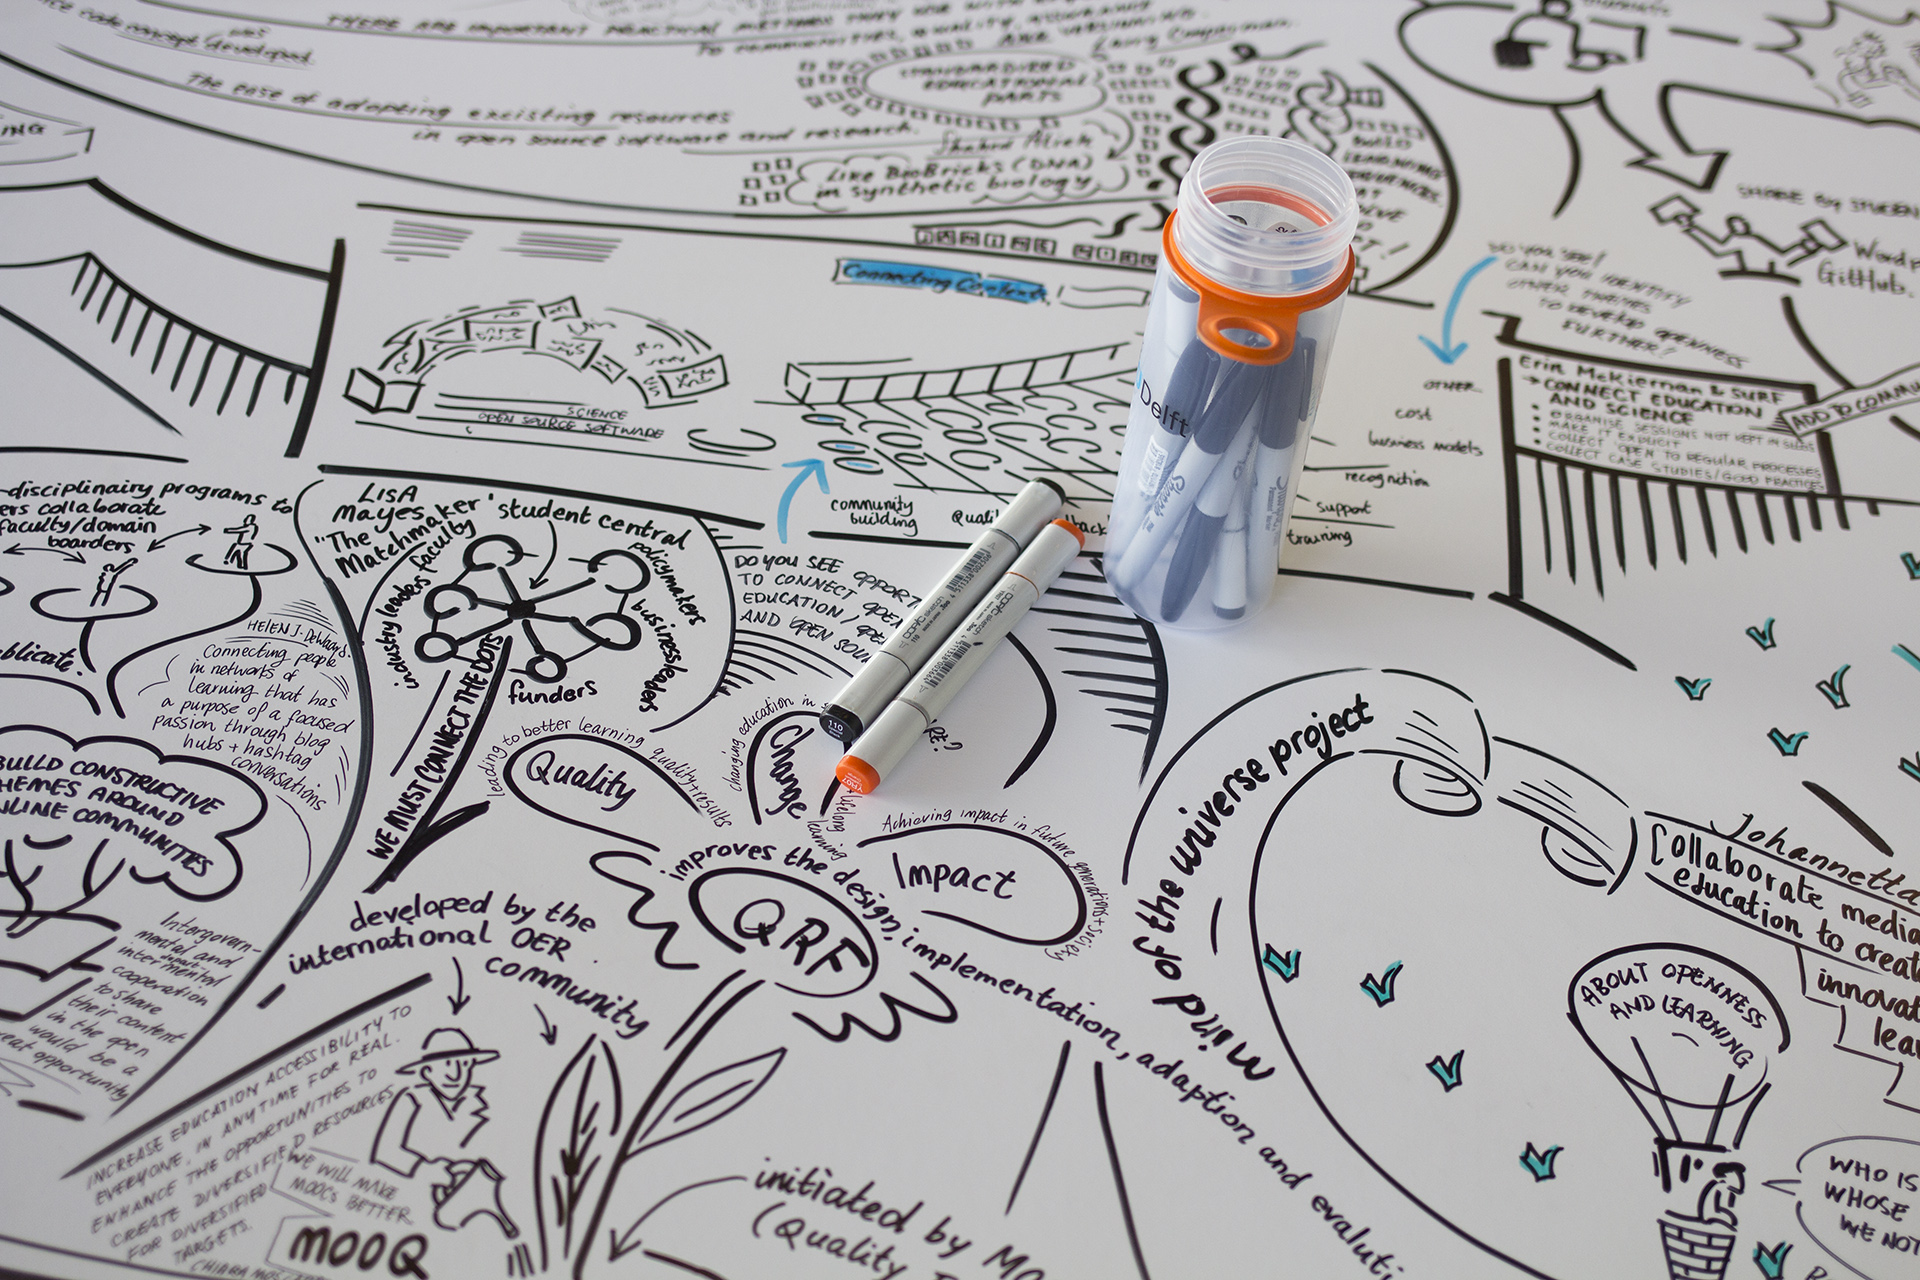 Details from the live visualization.
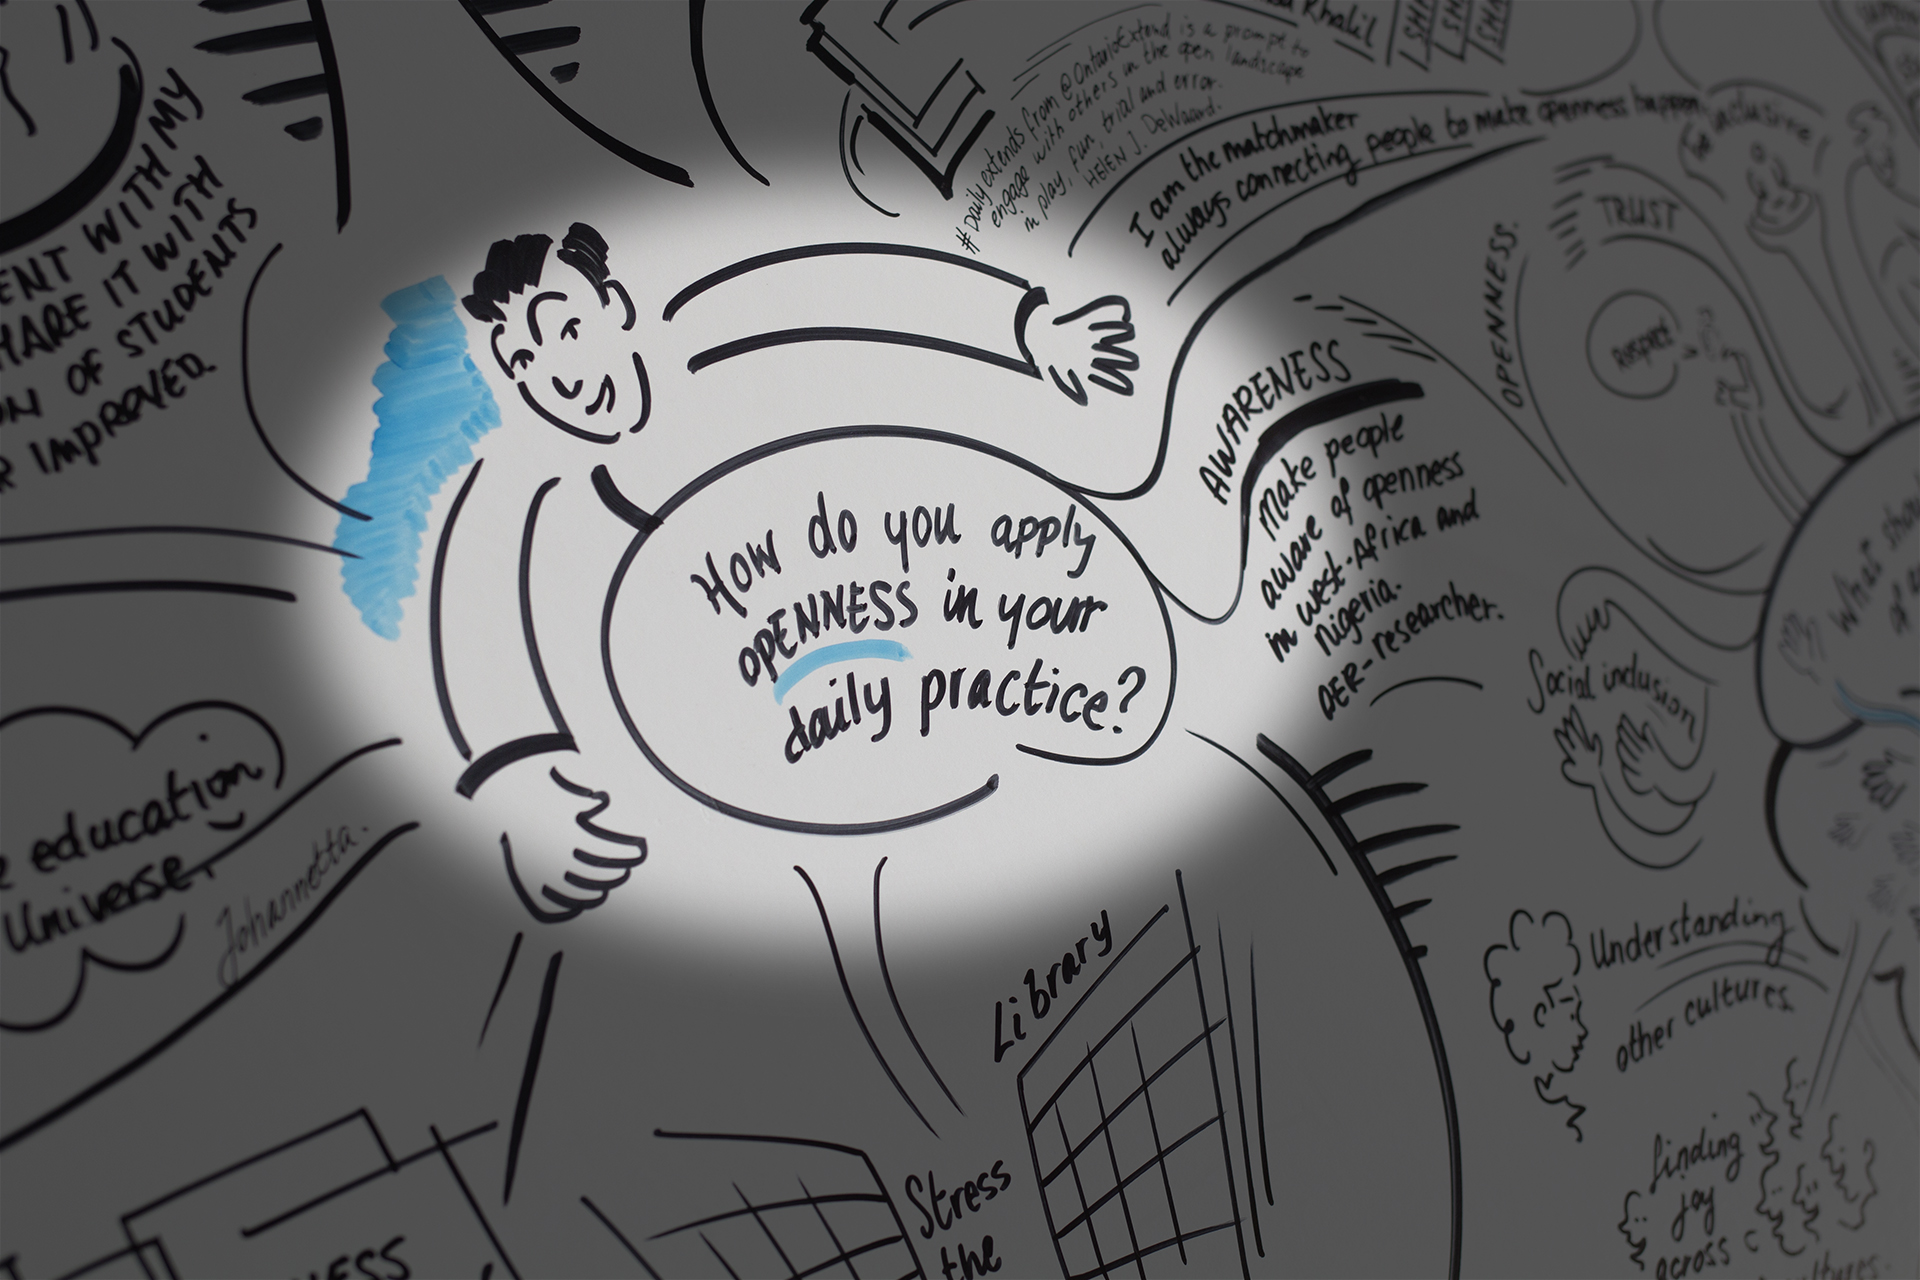
The participants responded to several questions.
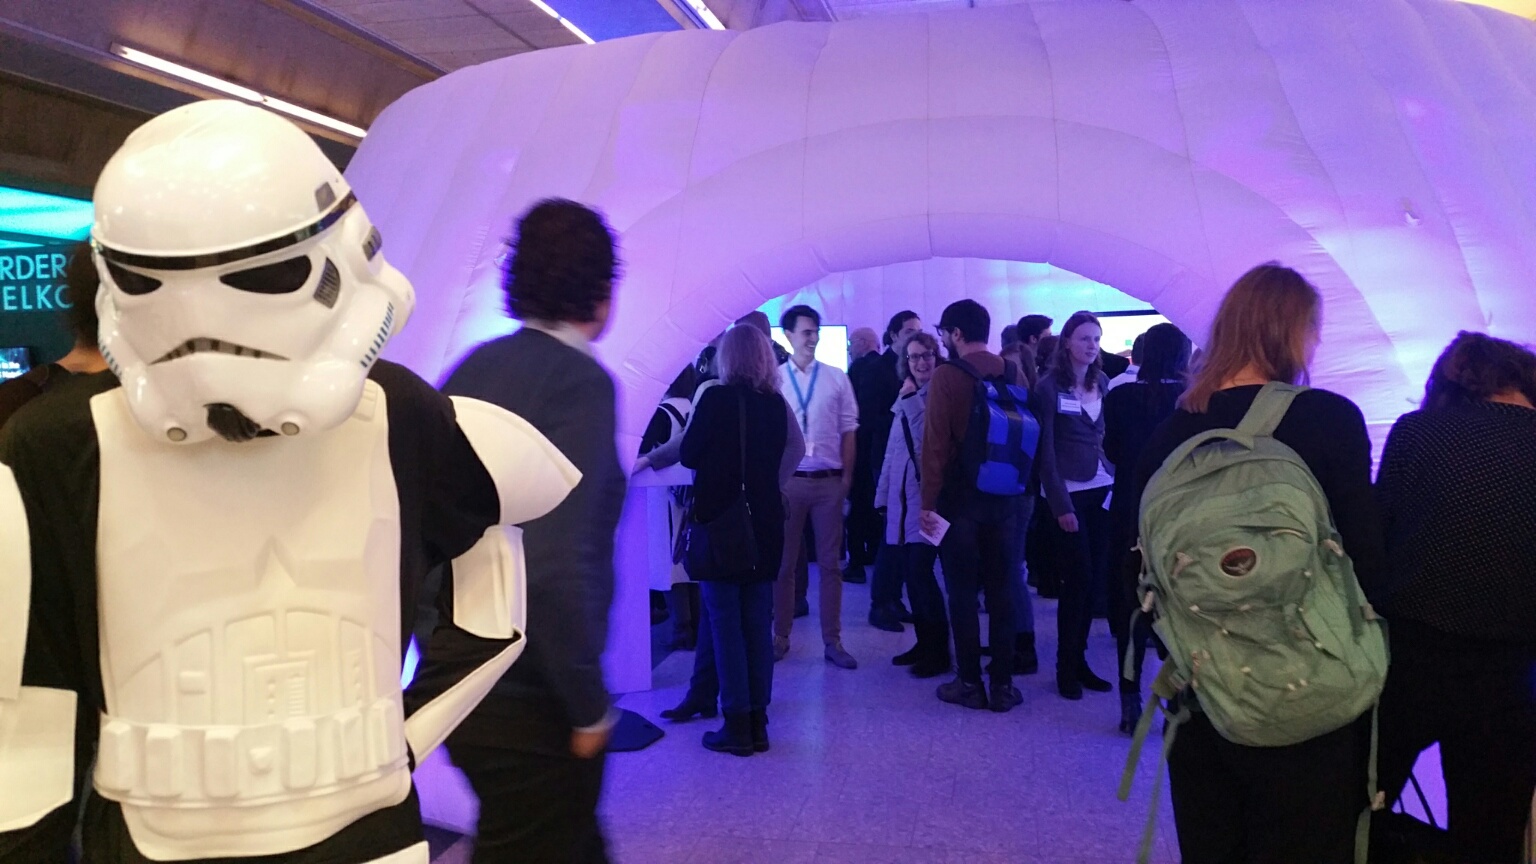 Conversations and a visual brainstorm at the Open Science dome.
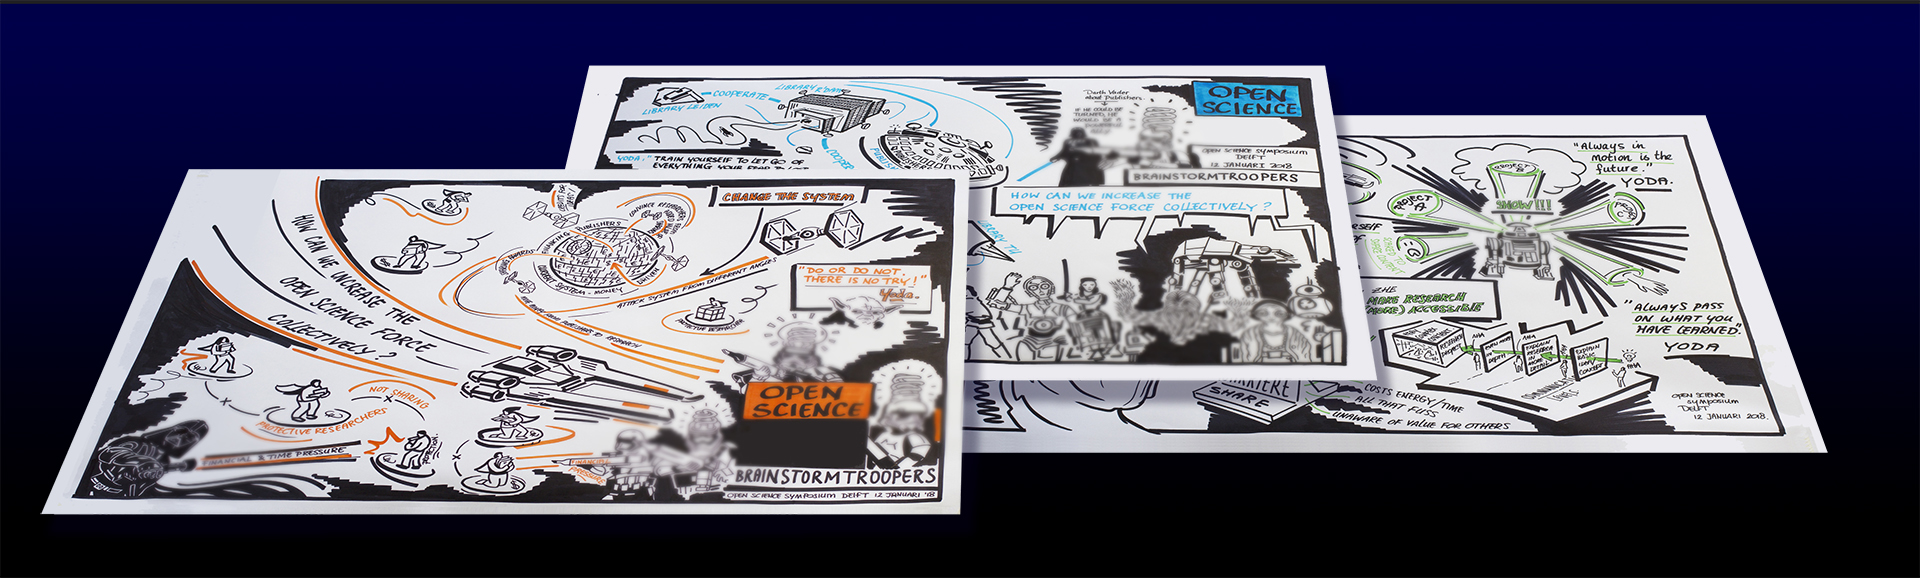 Visualisations inspired by the theme and by input from symposium participants.
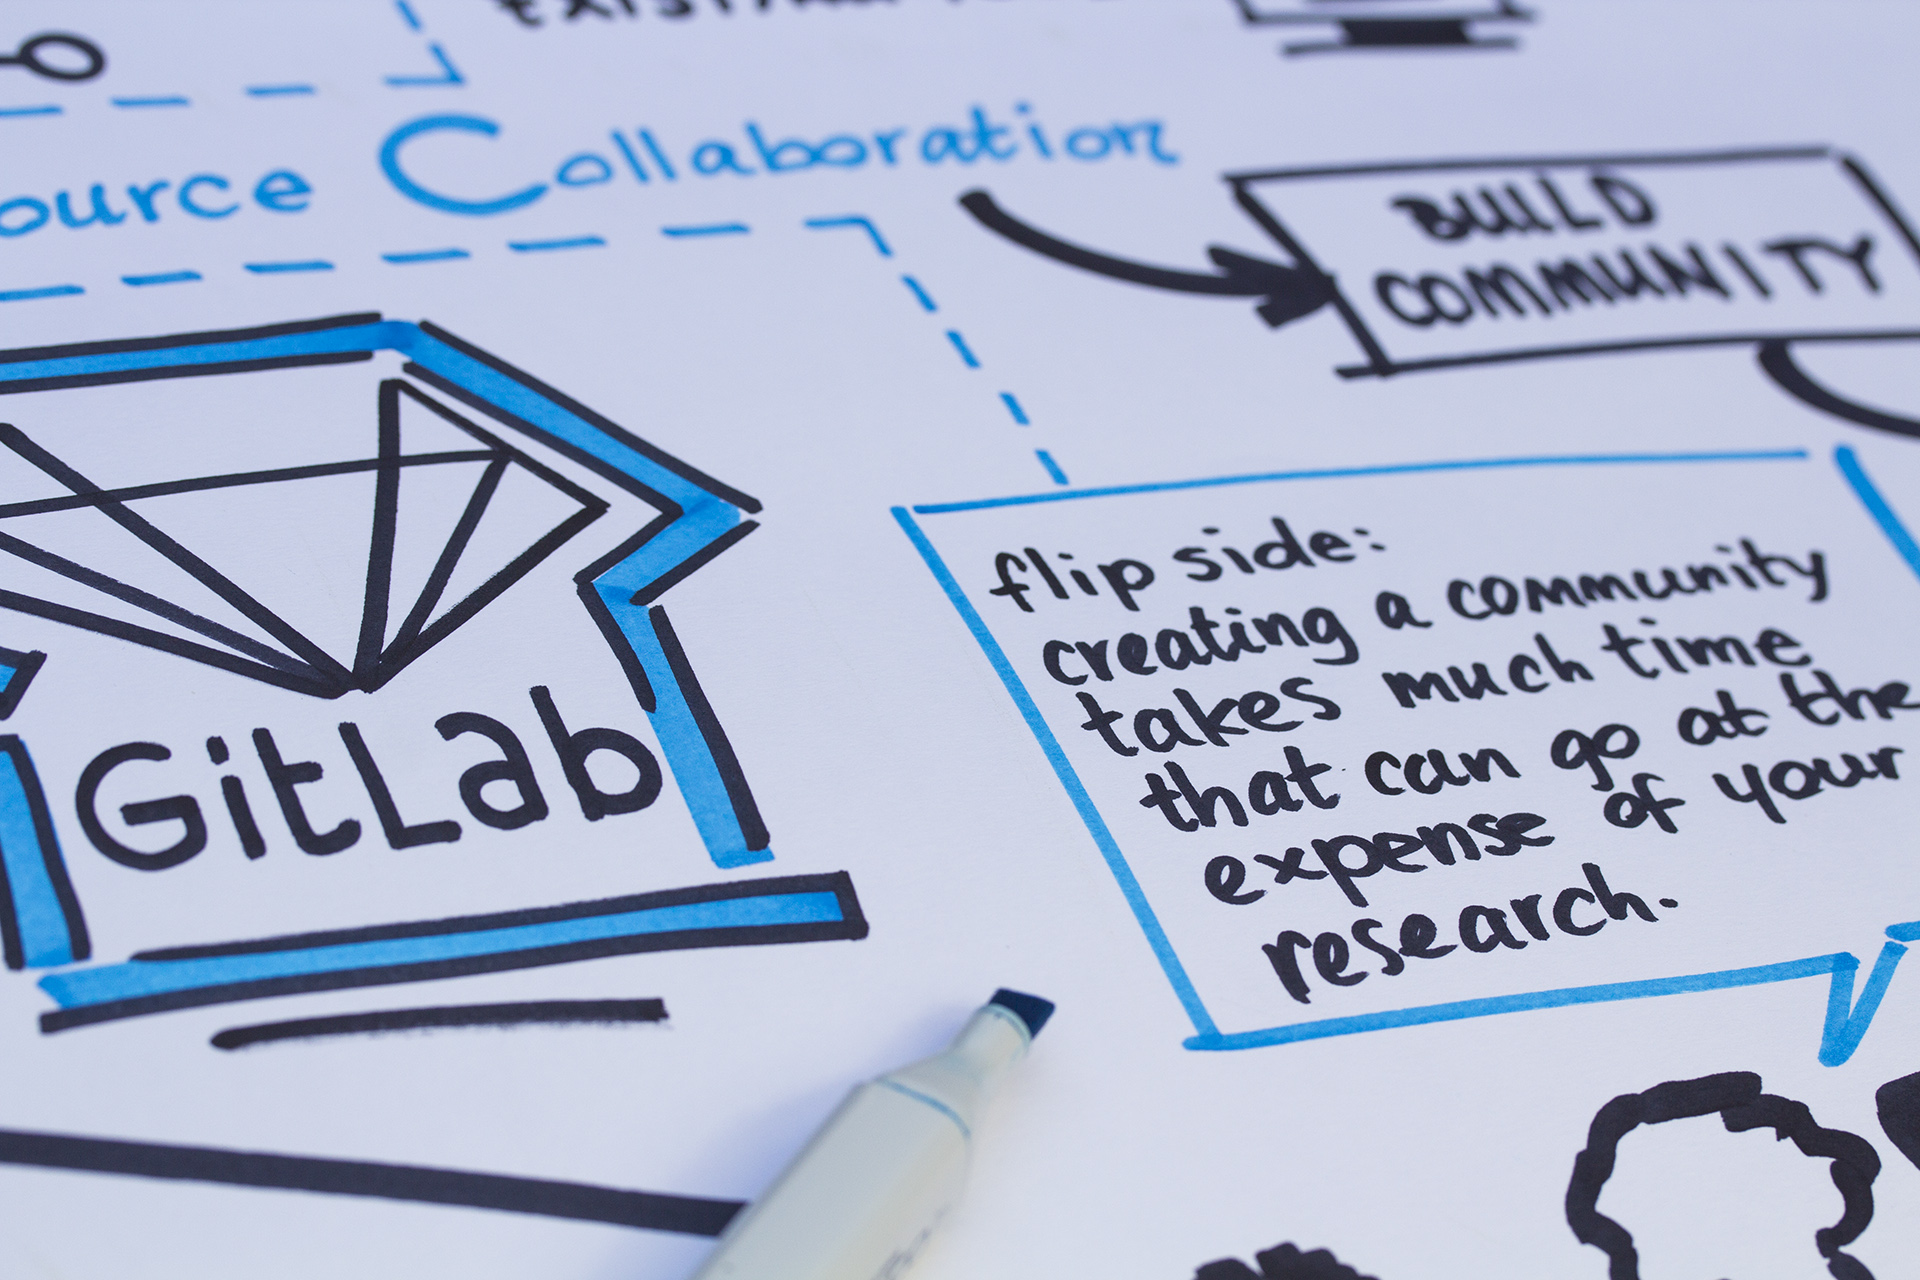 Open Source Sandbox Session 3
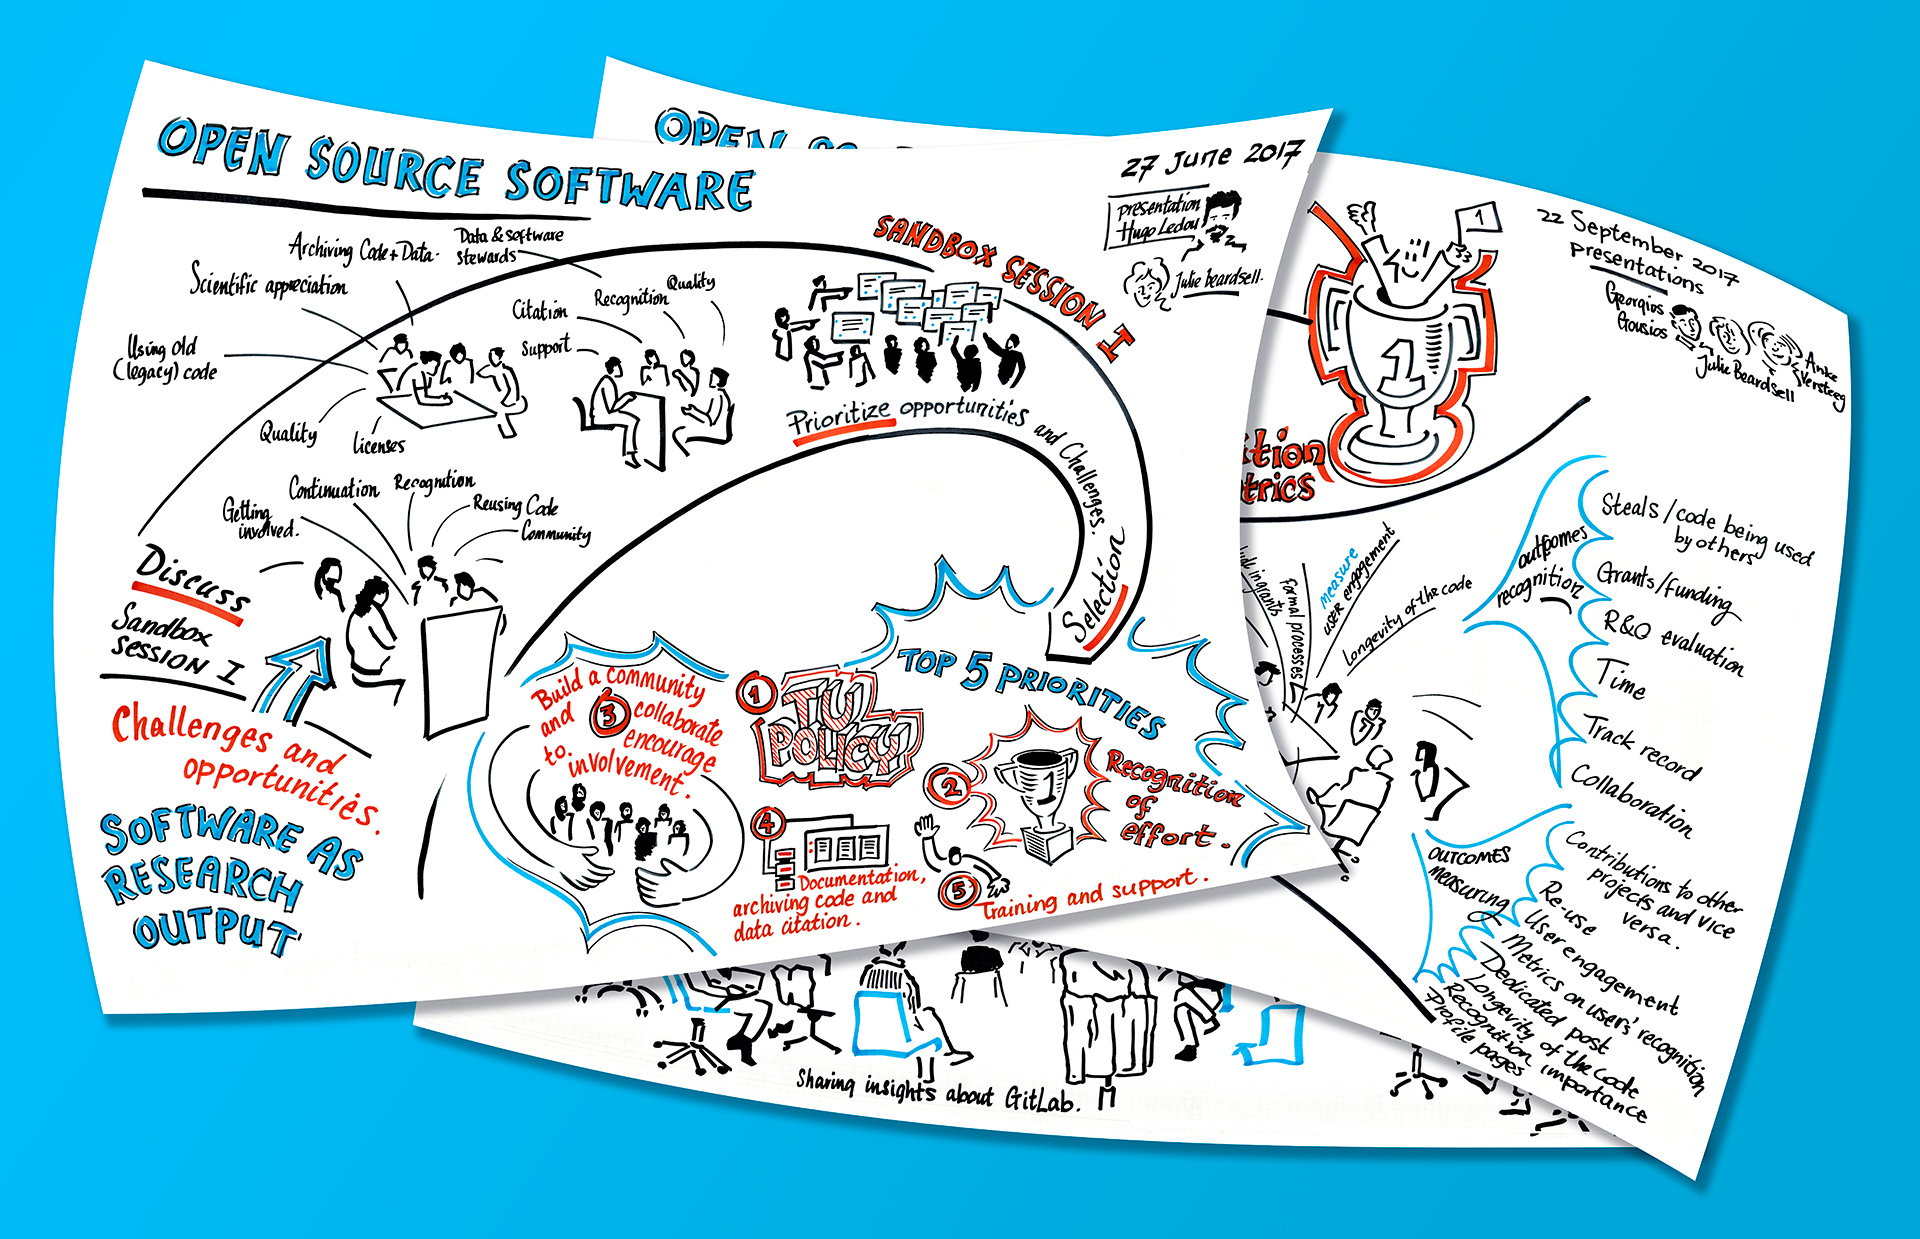
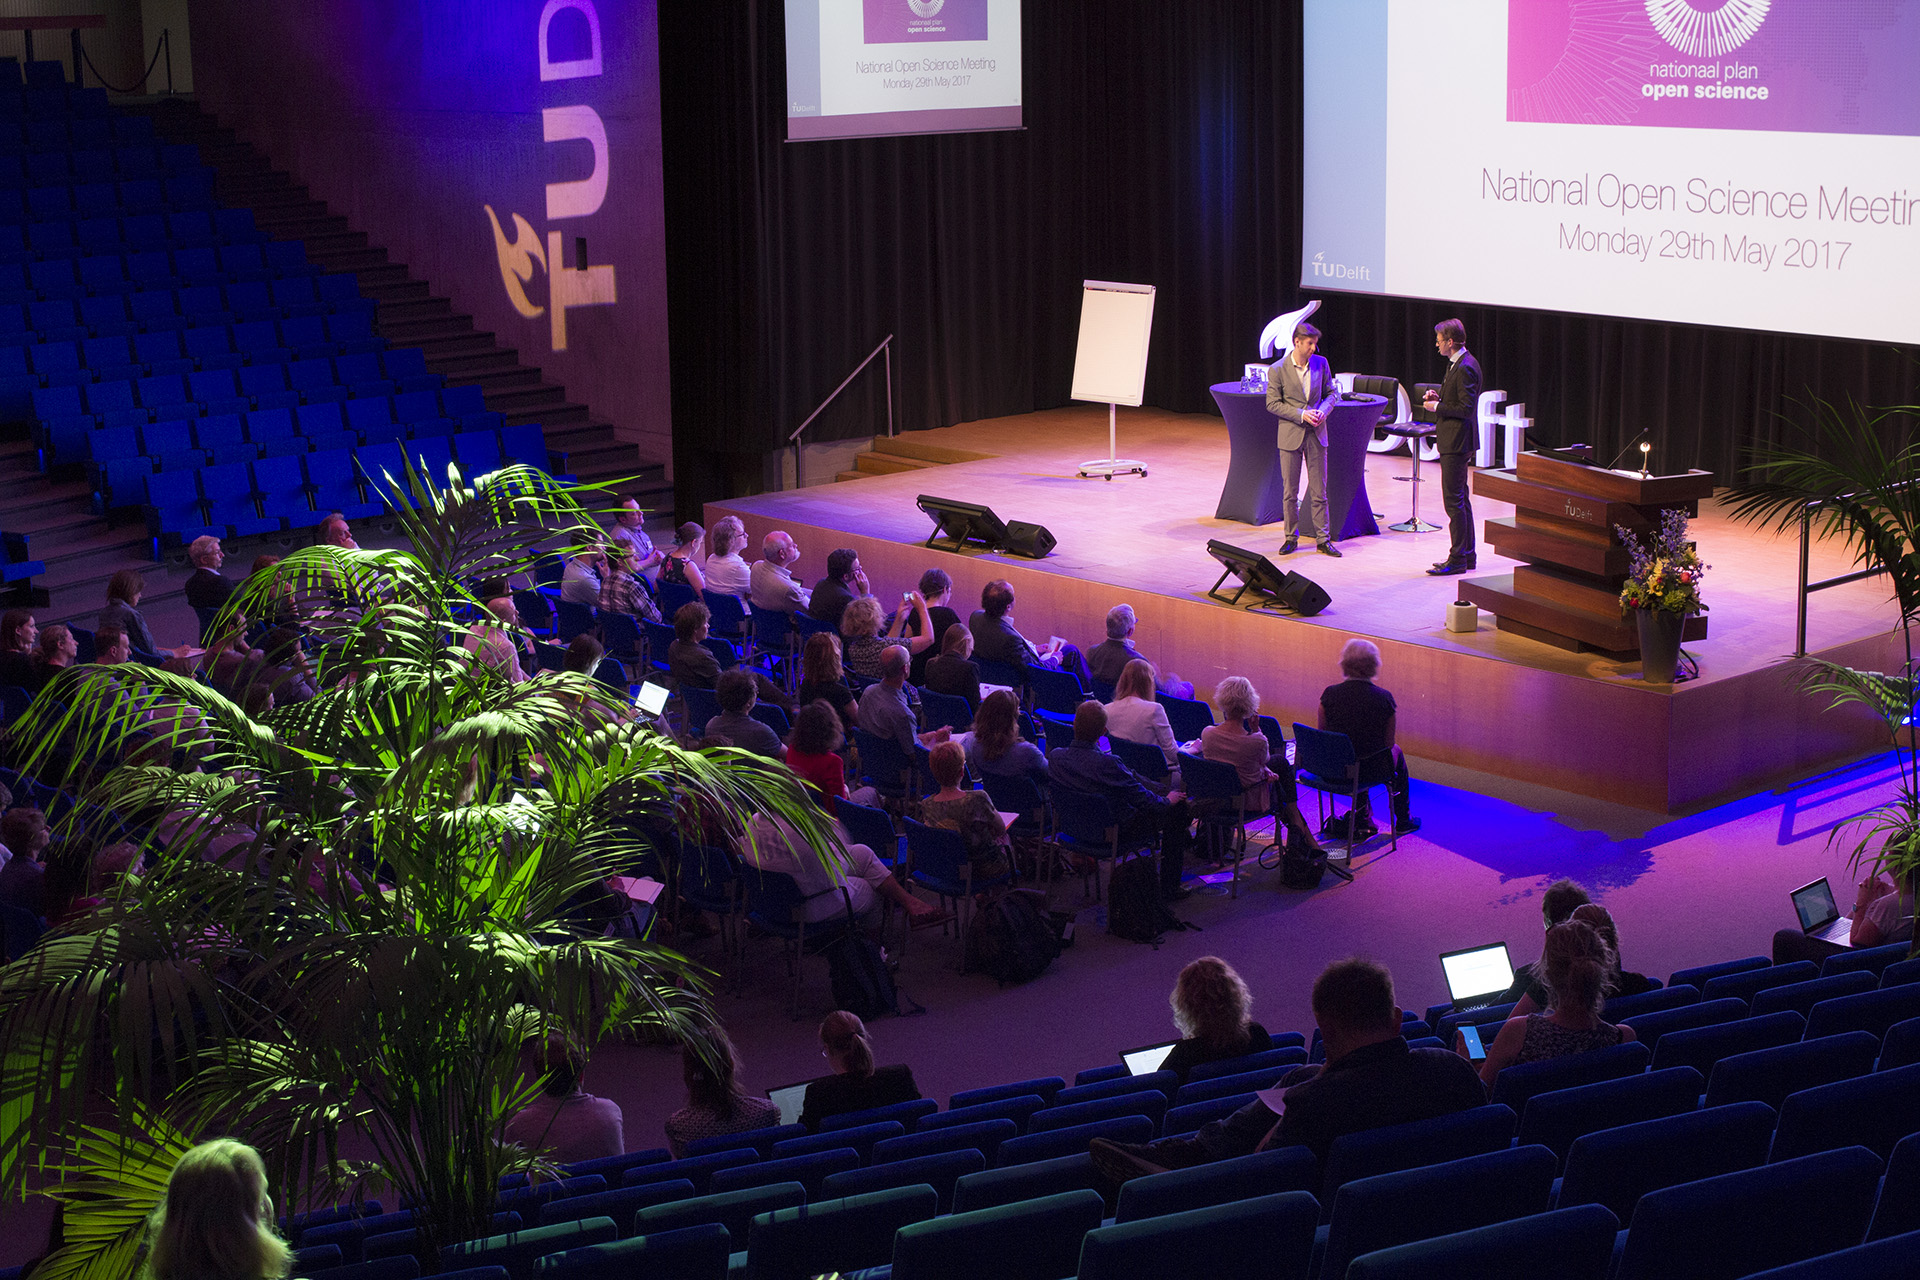 Presentations at the
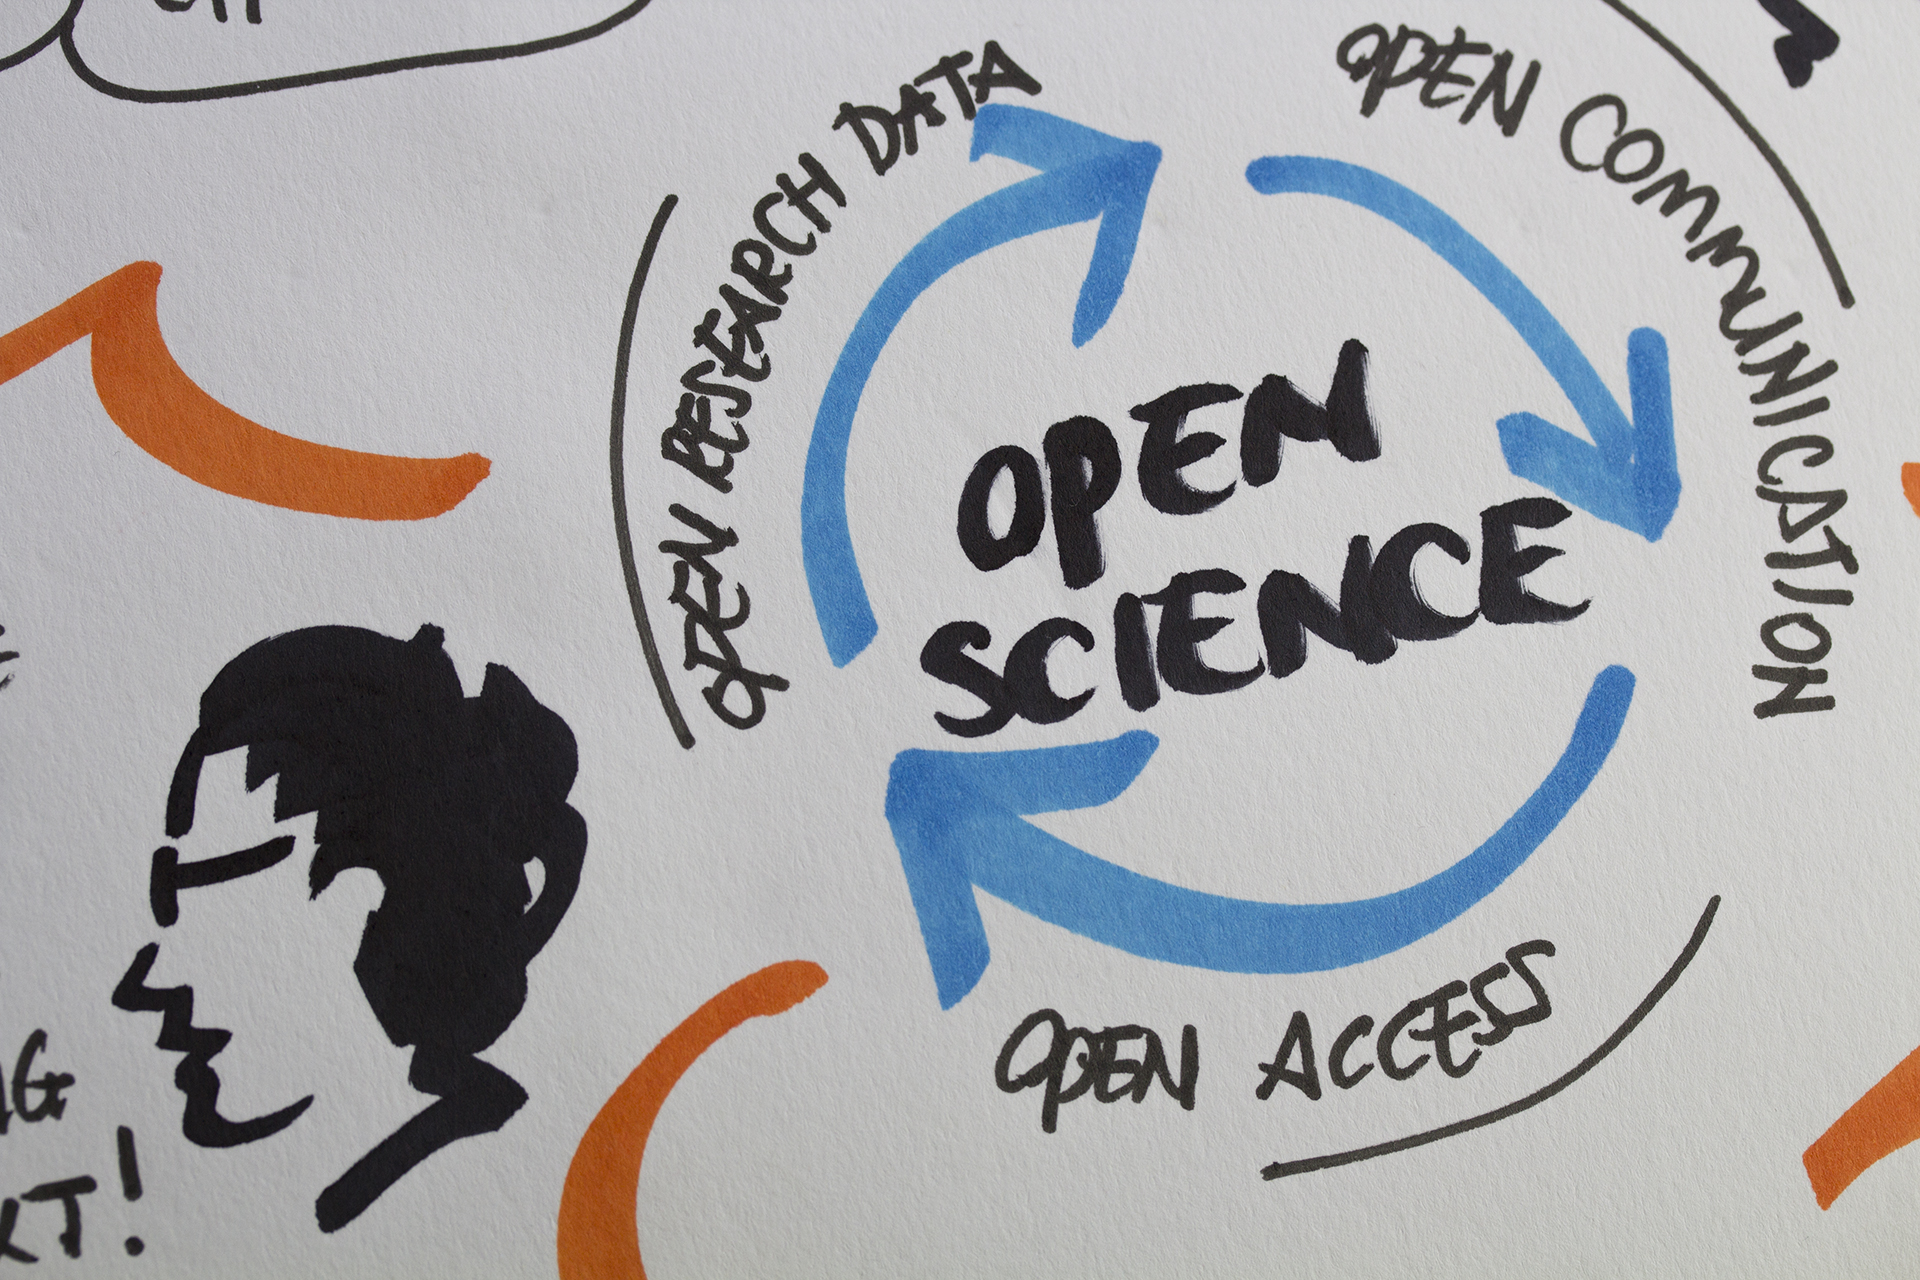
 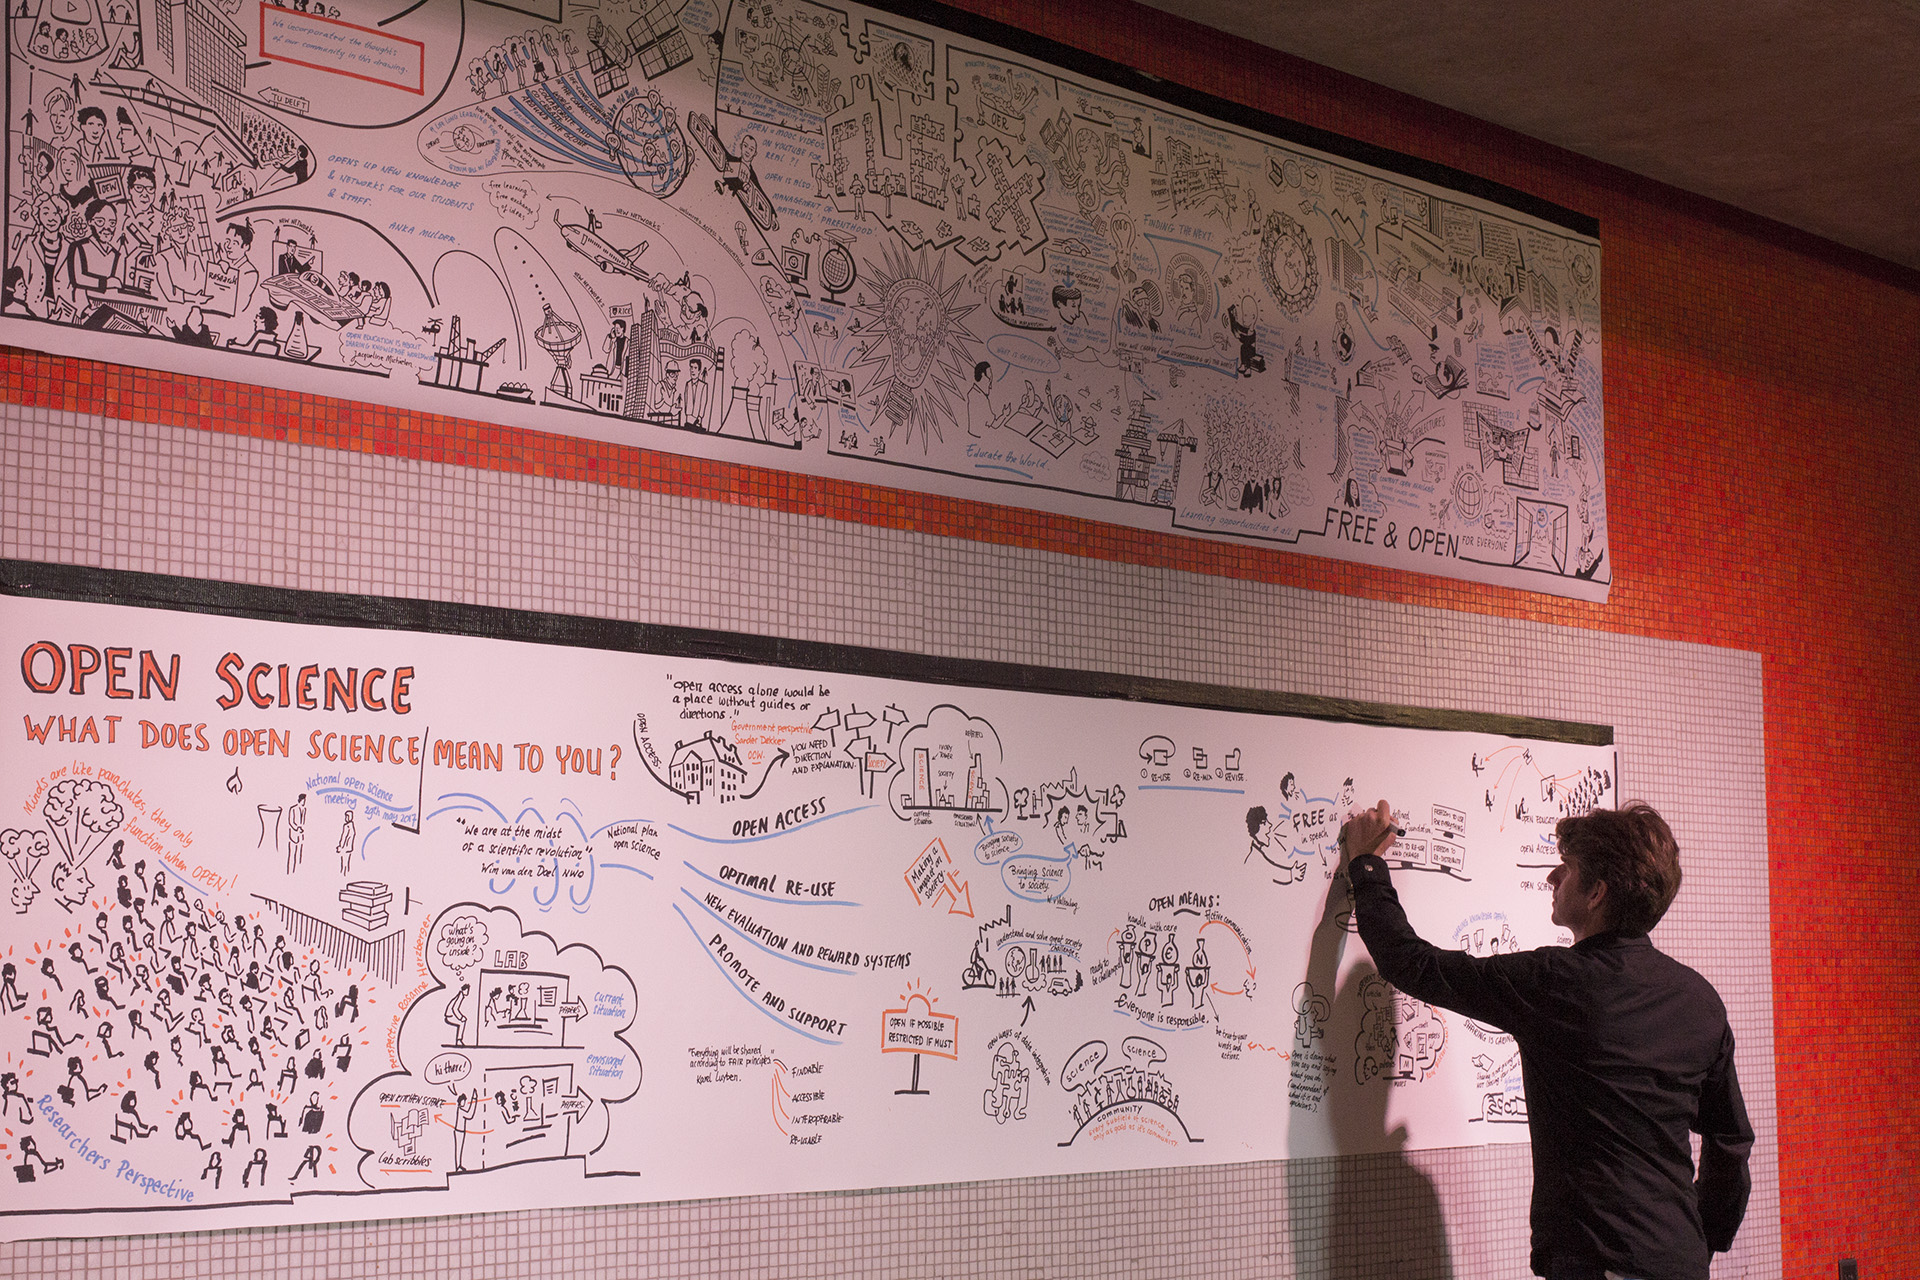 Visual notes based on the participants input: “What does Open Science mean to you?”
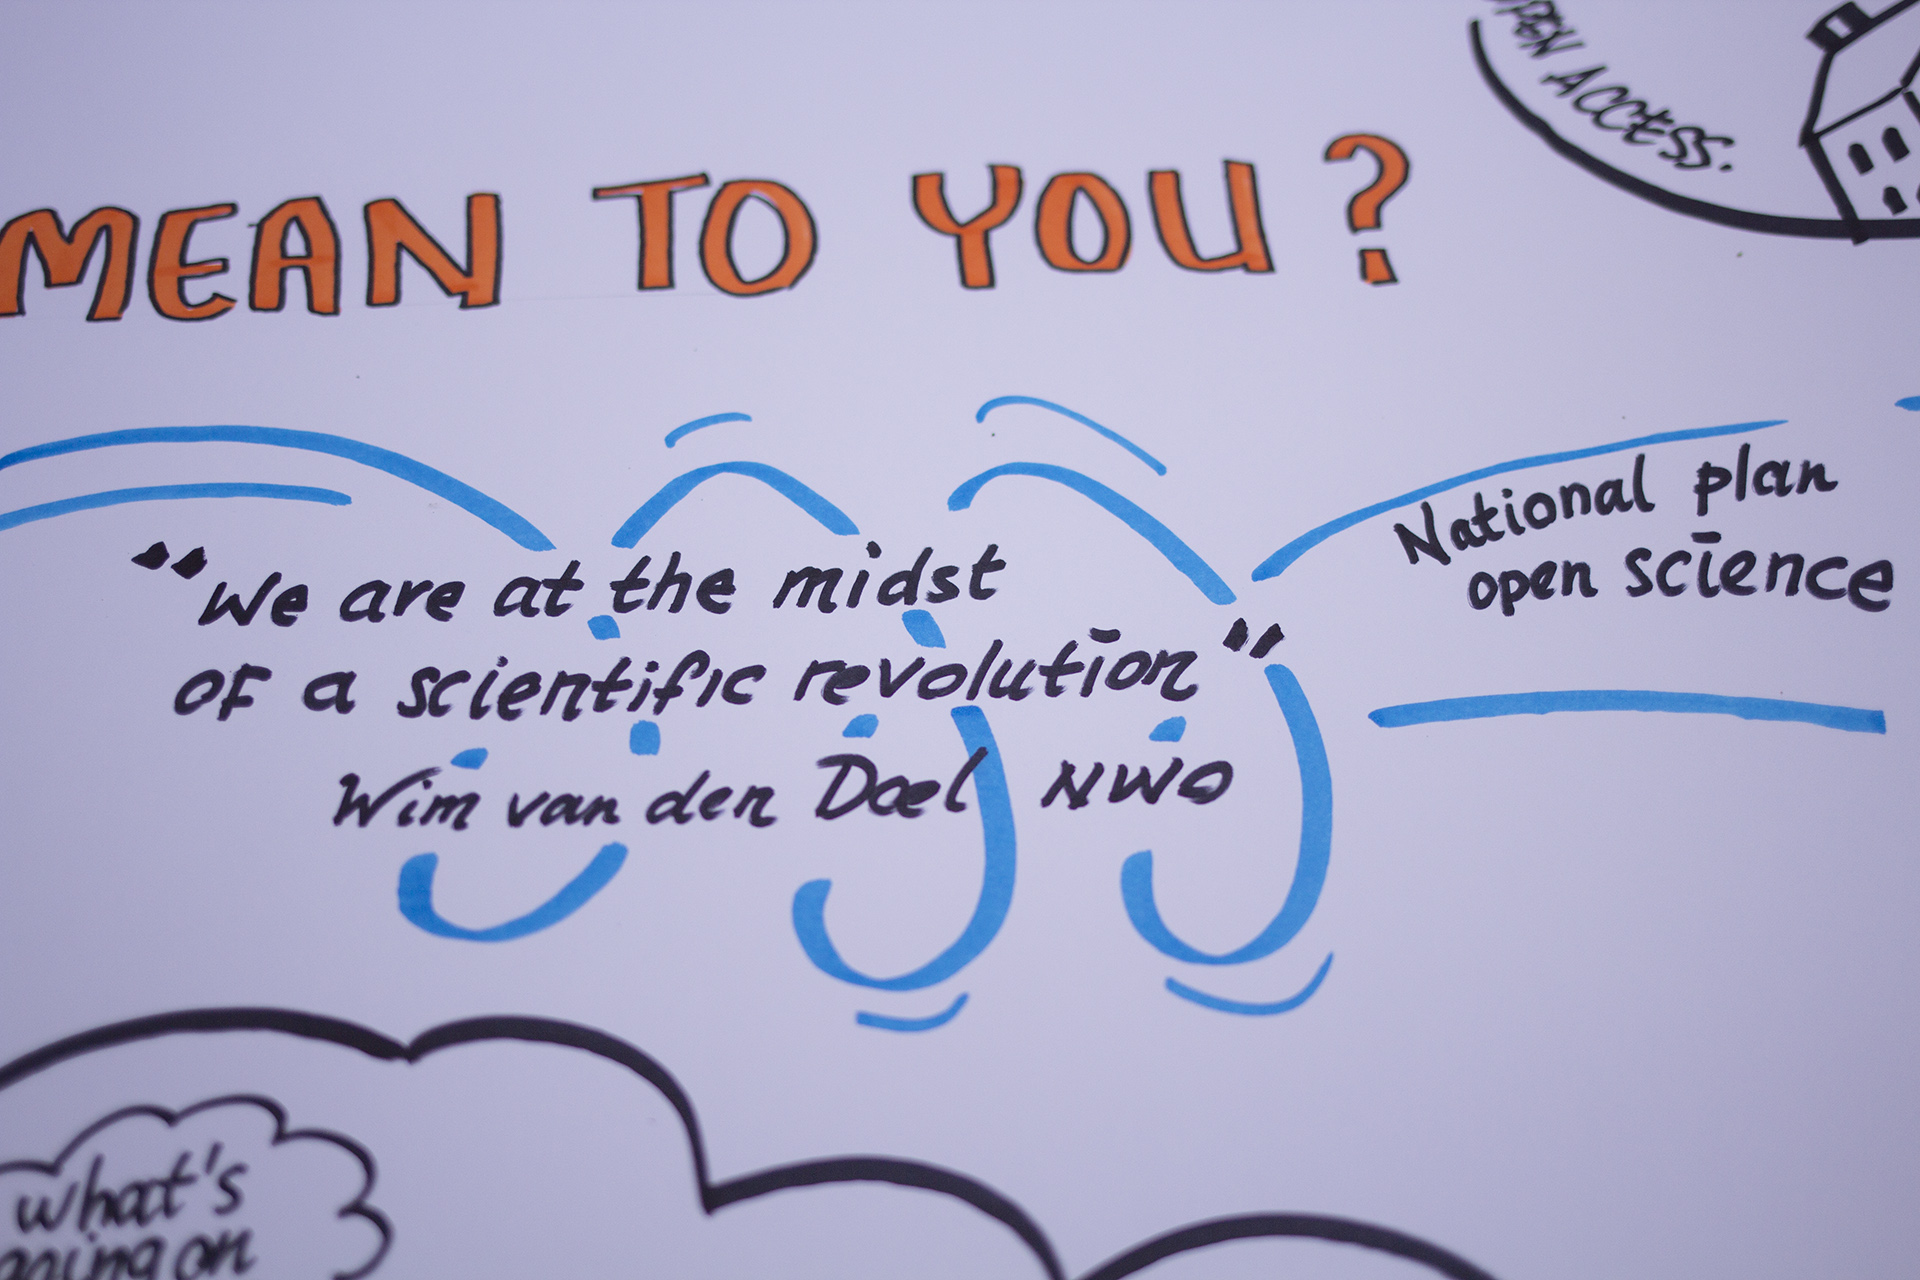 Wim van den Doel (NWO) about open access, open data and rewarding open science.
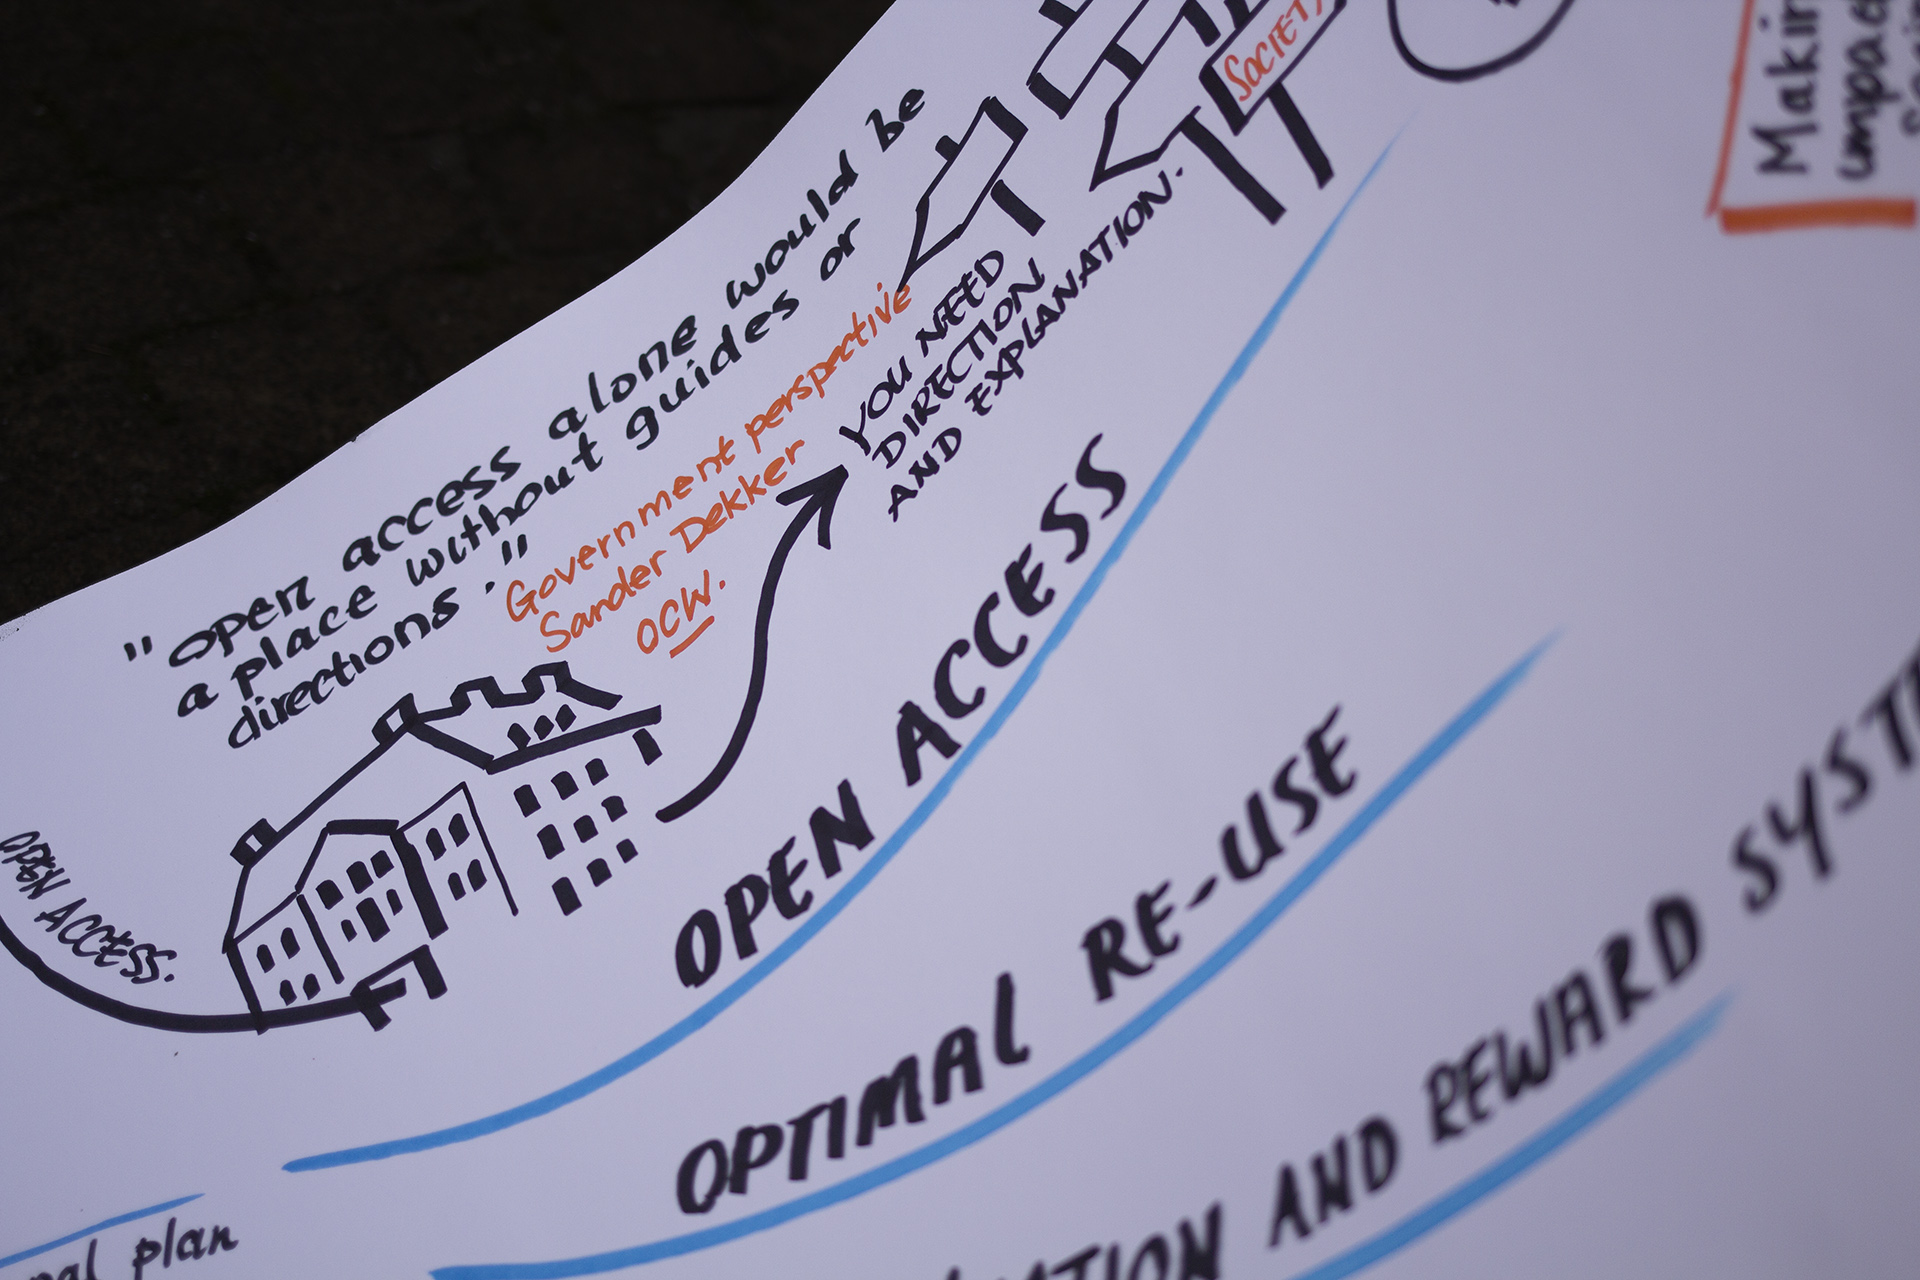 Sander Dekker (OCW) about access and guidance.
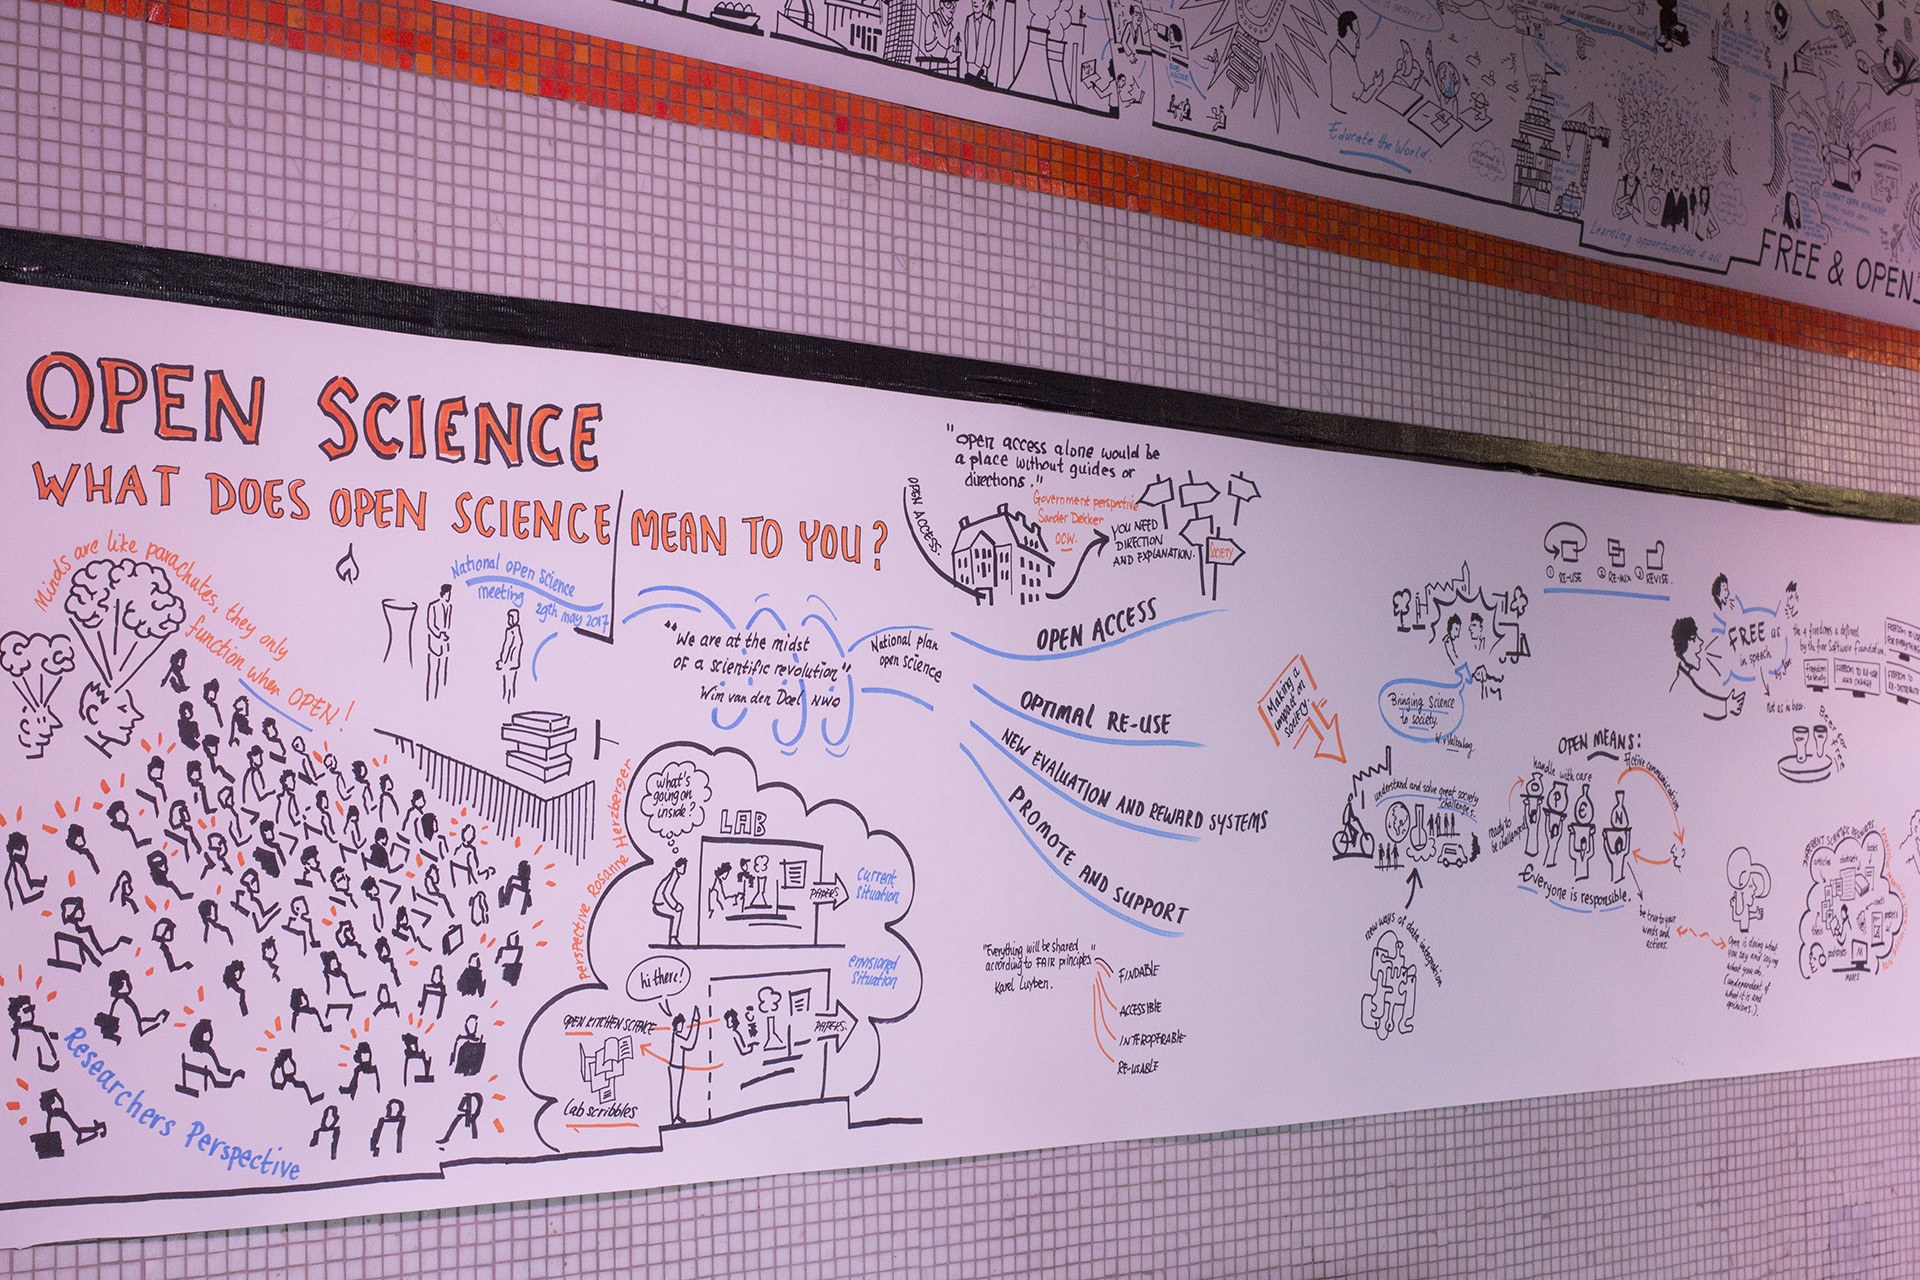
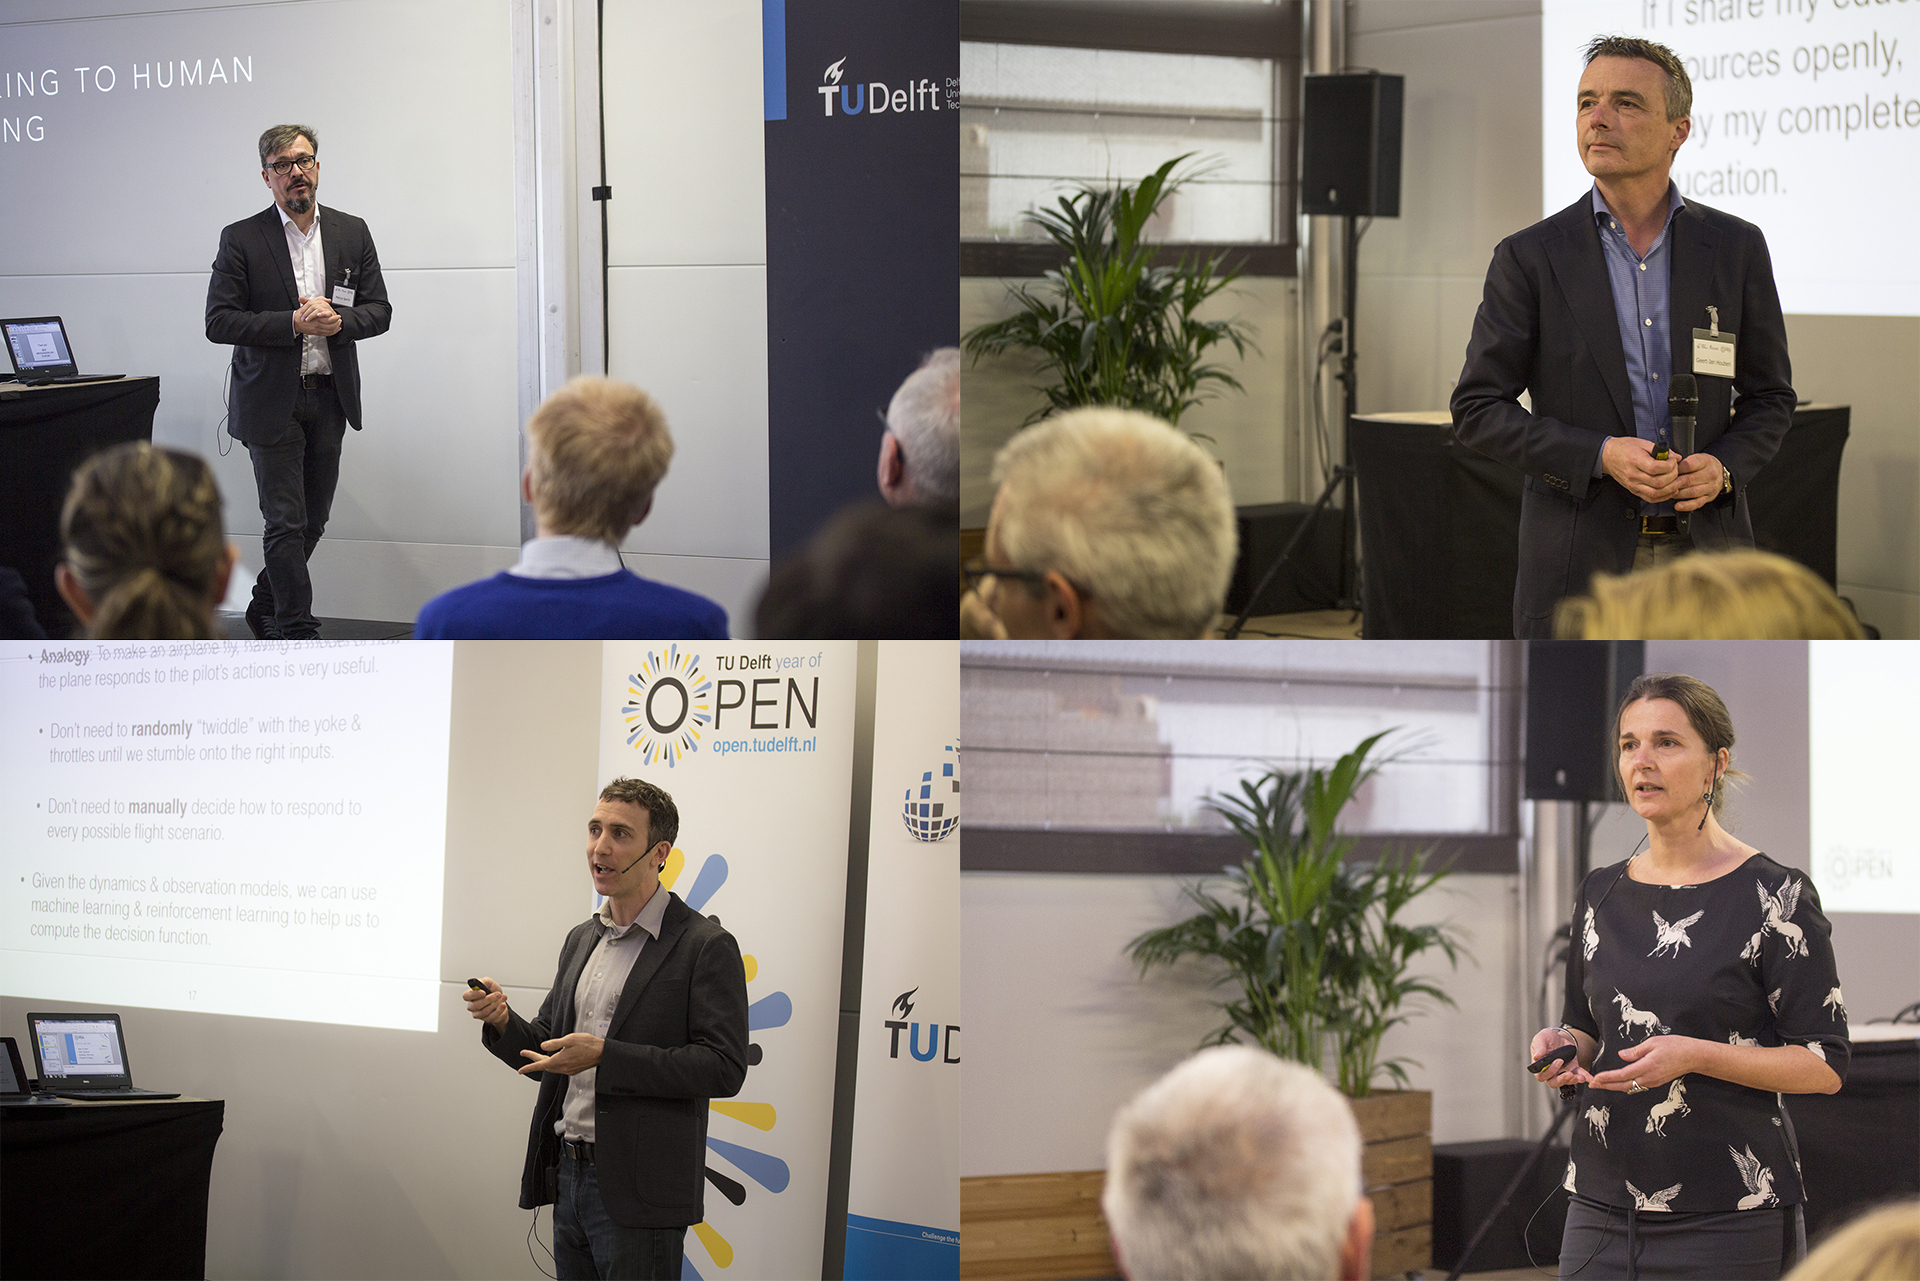
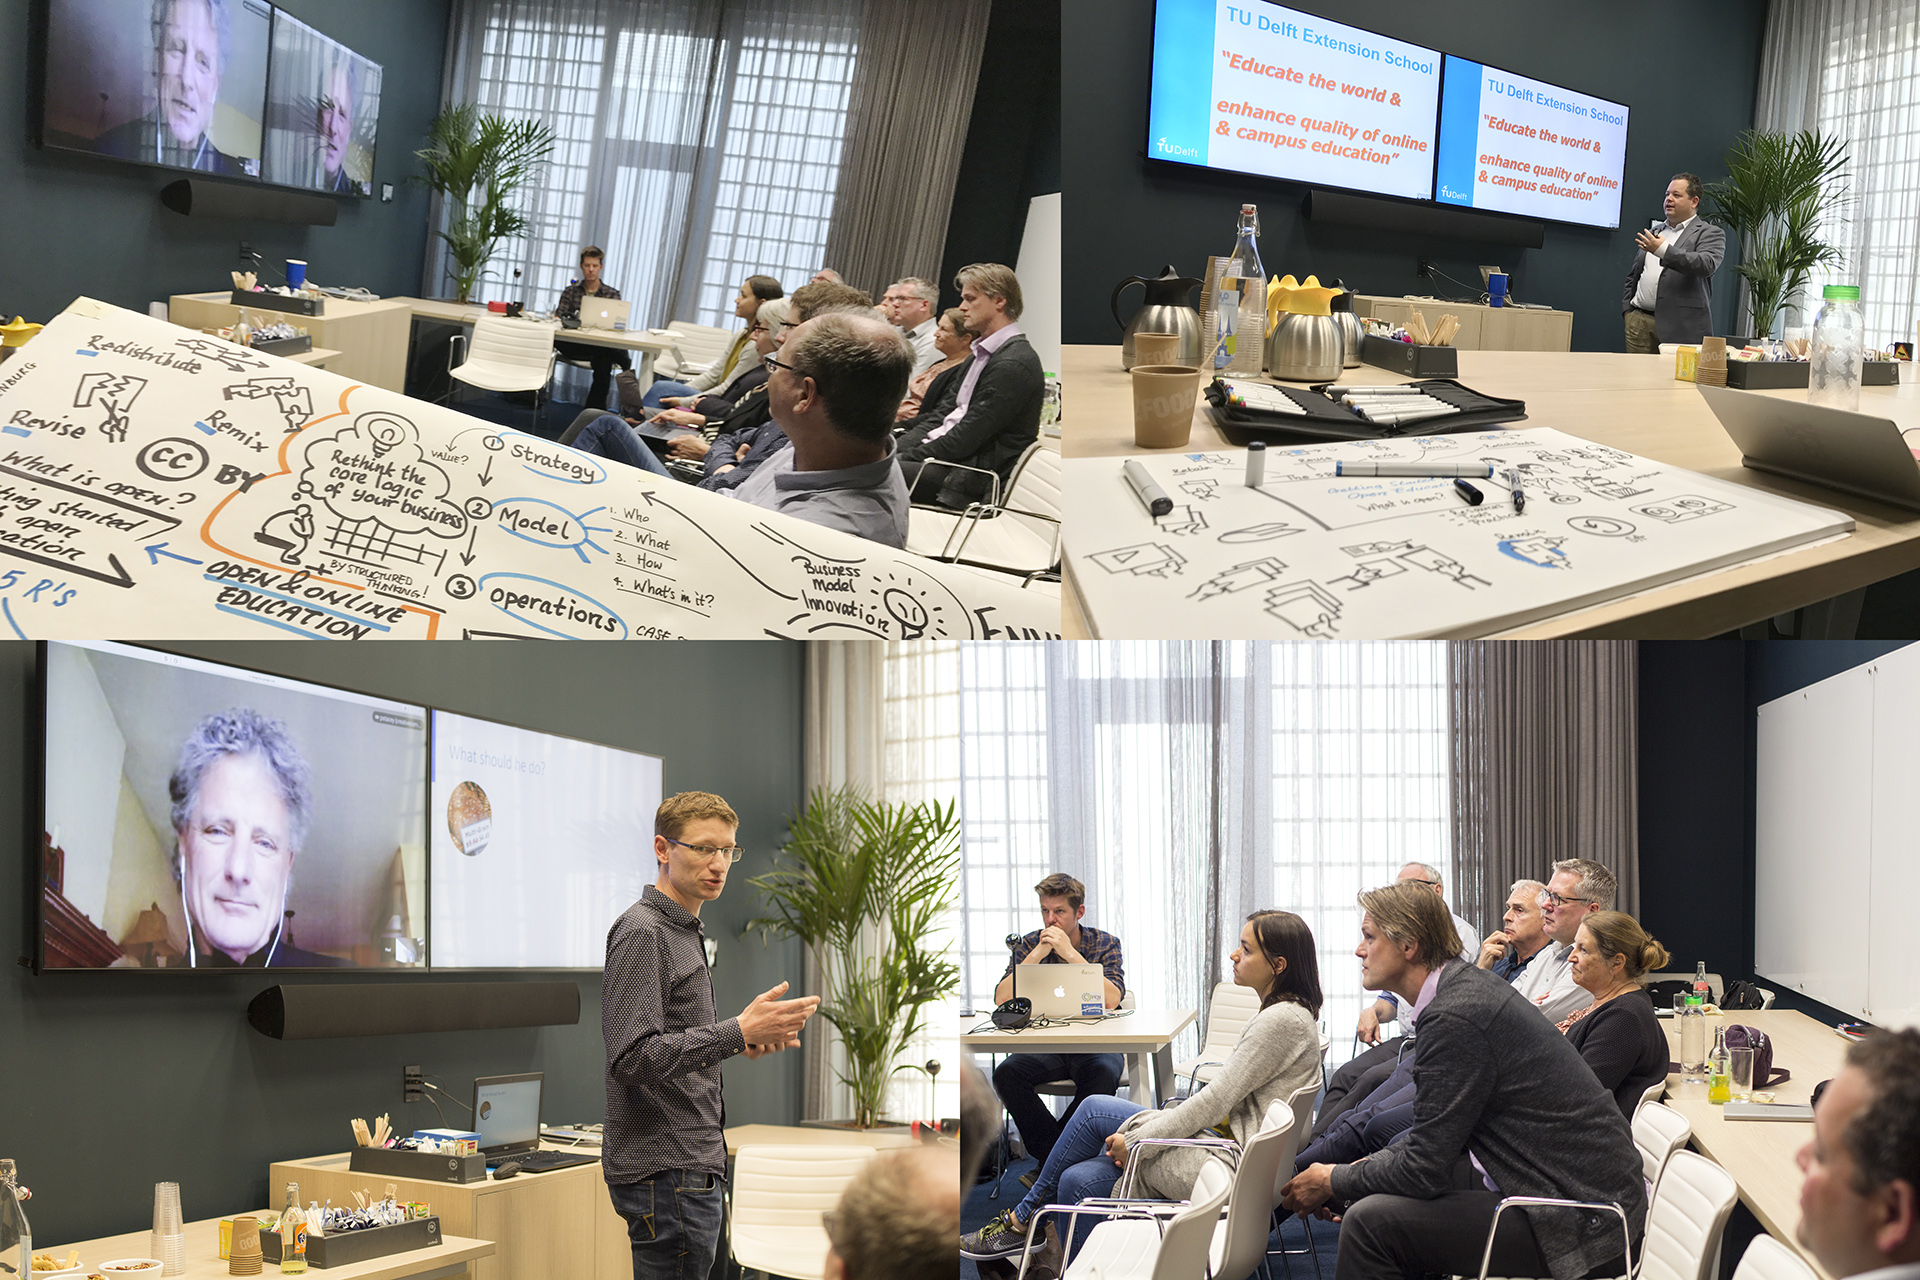 Speakers at the Open Business Models Session: Paul Stacey, Mark de Reuver and Willem van Valkenburg.
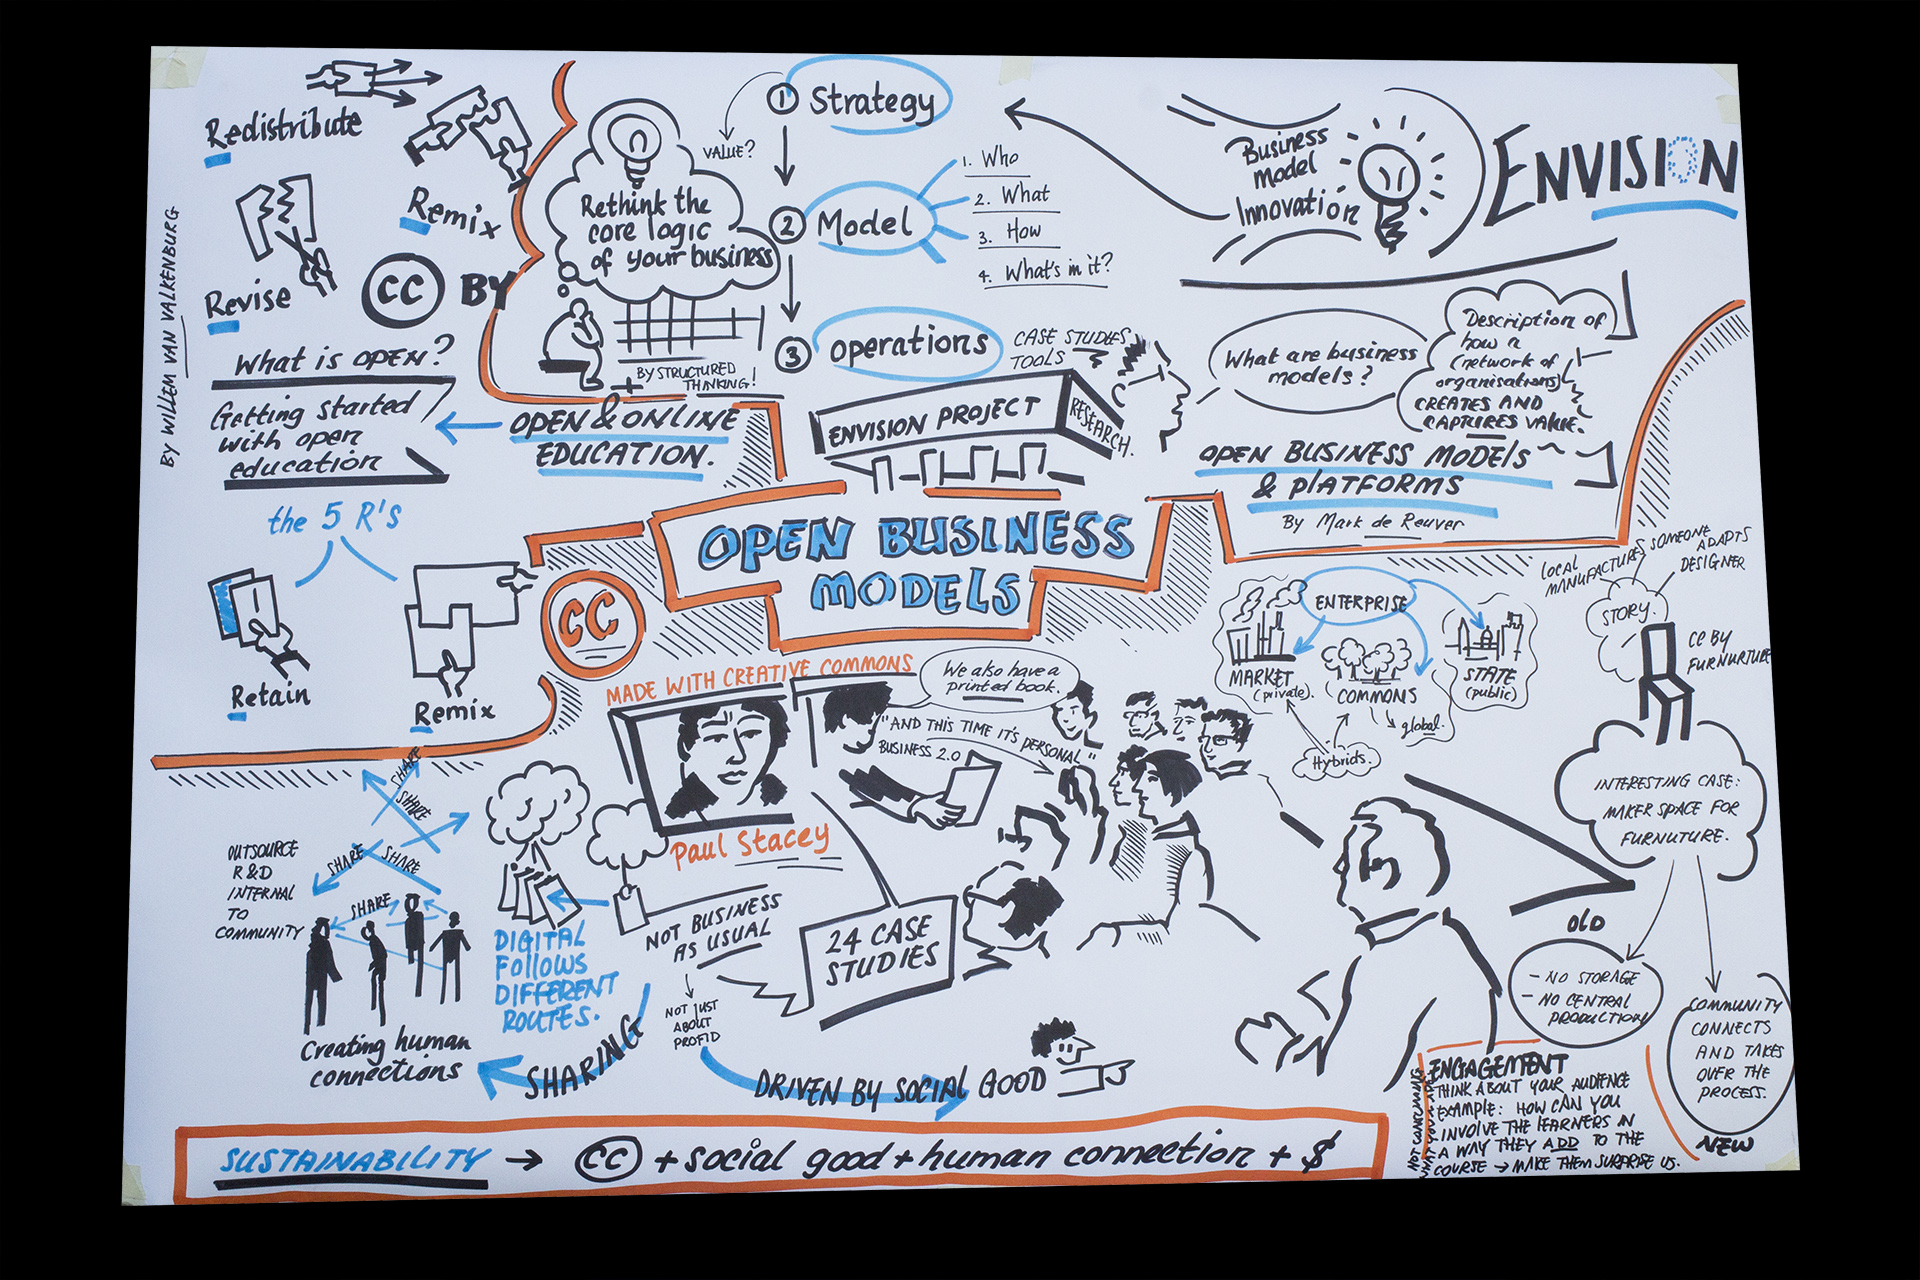 Visual notes at the Open Business Models Session.
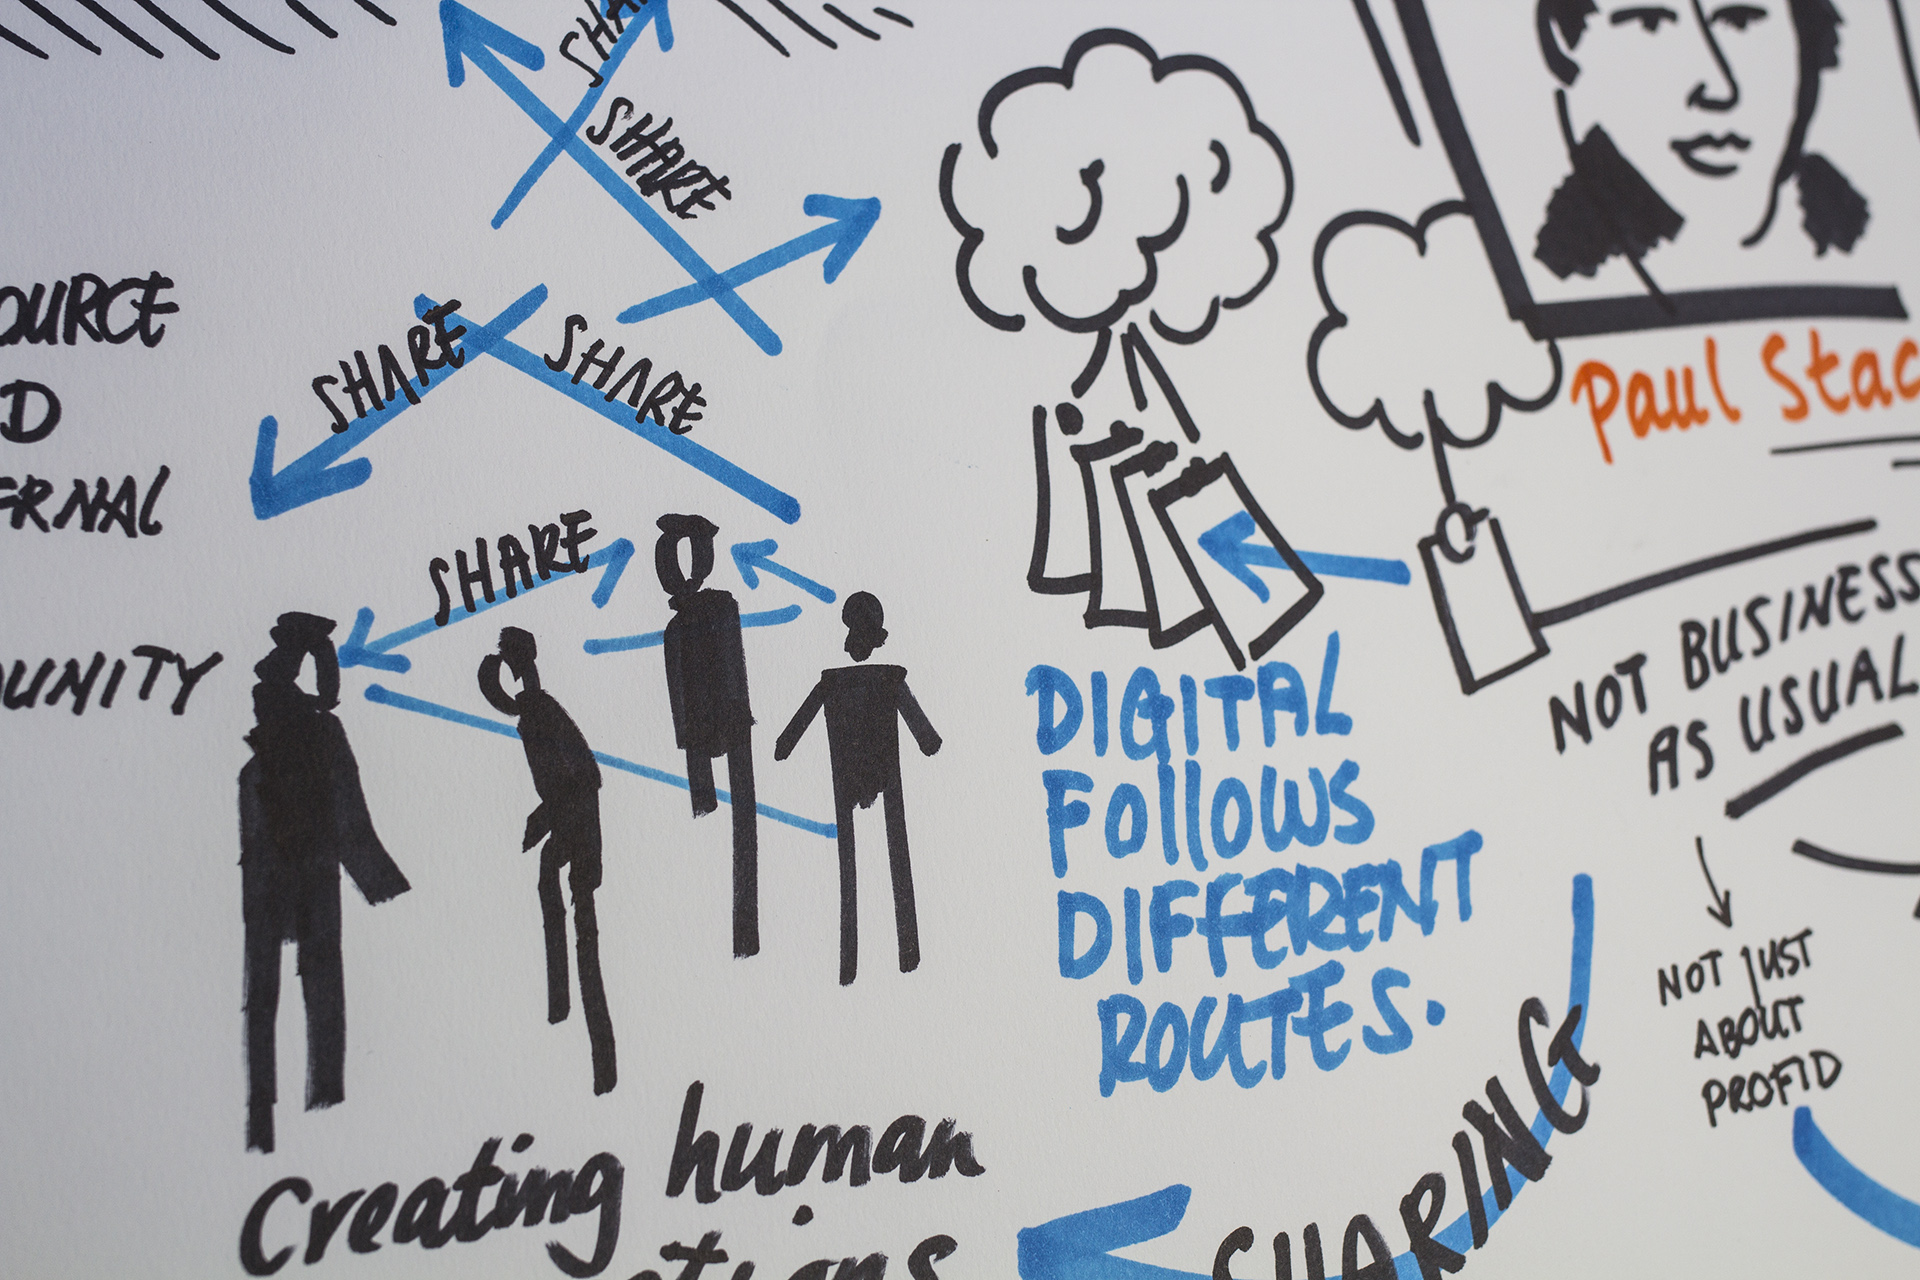 Paul Stacey about creating human connections and sharing.
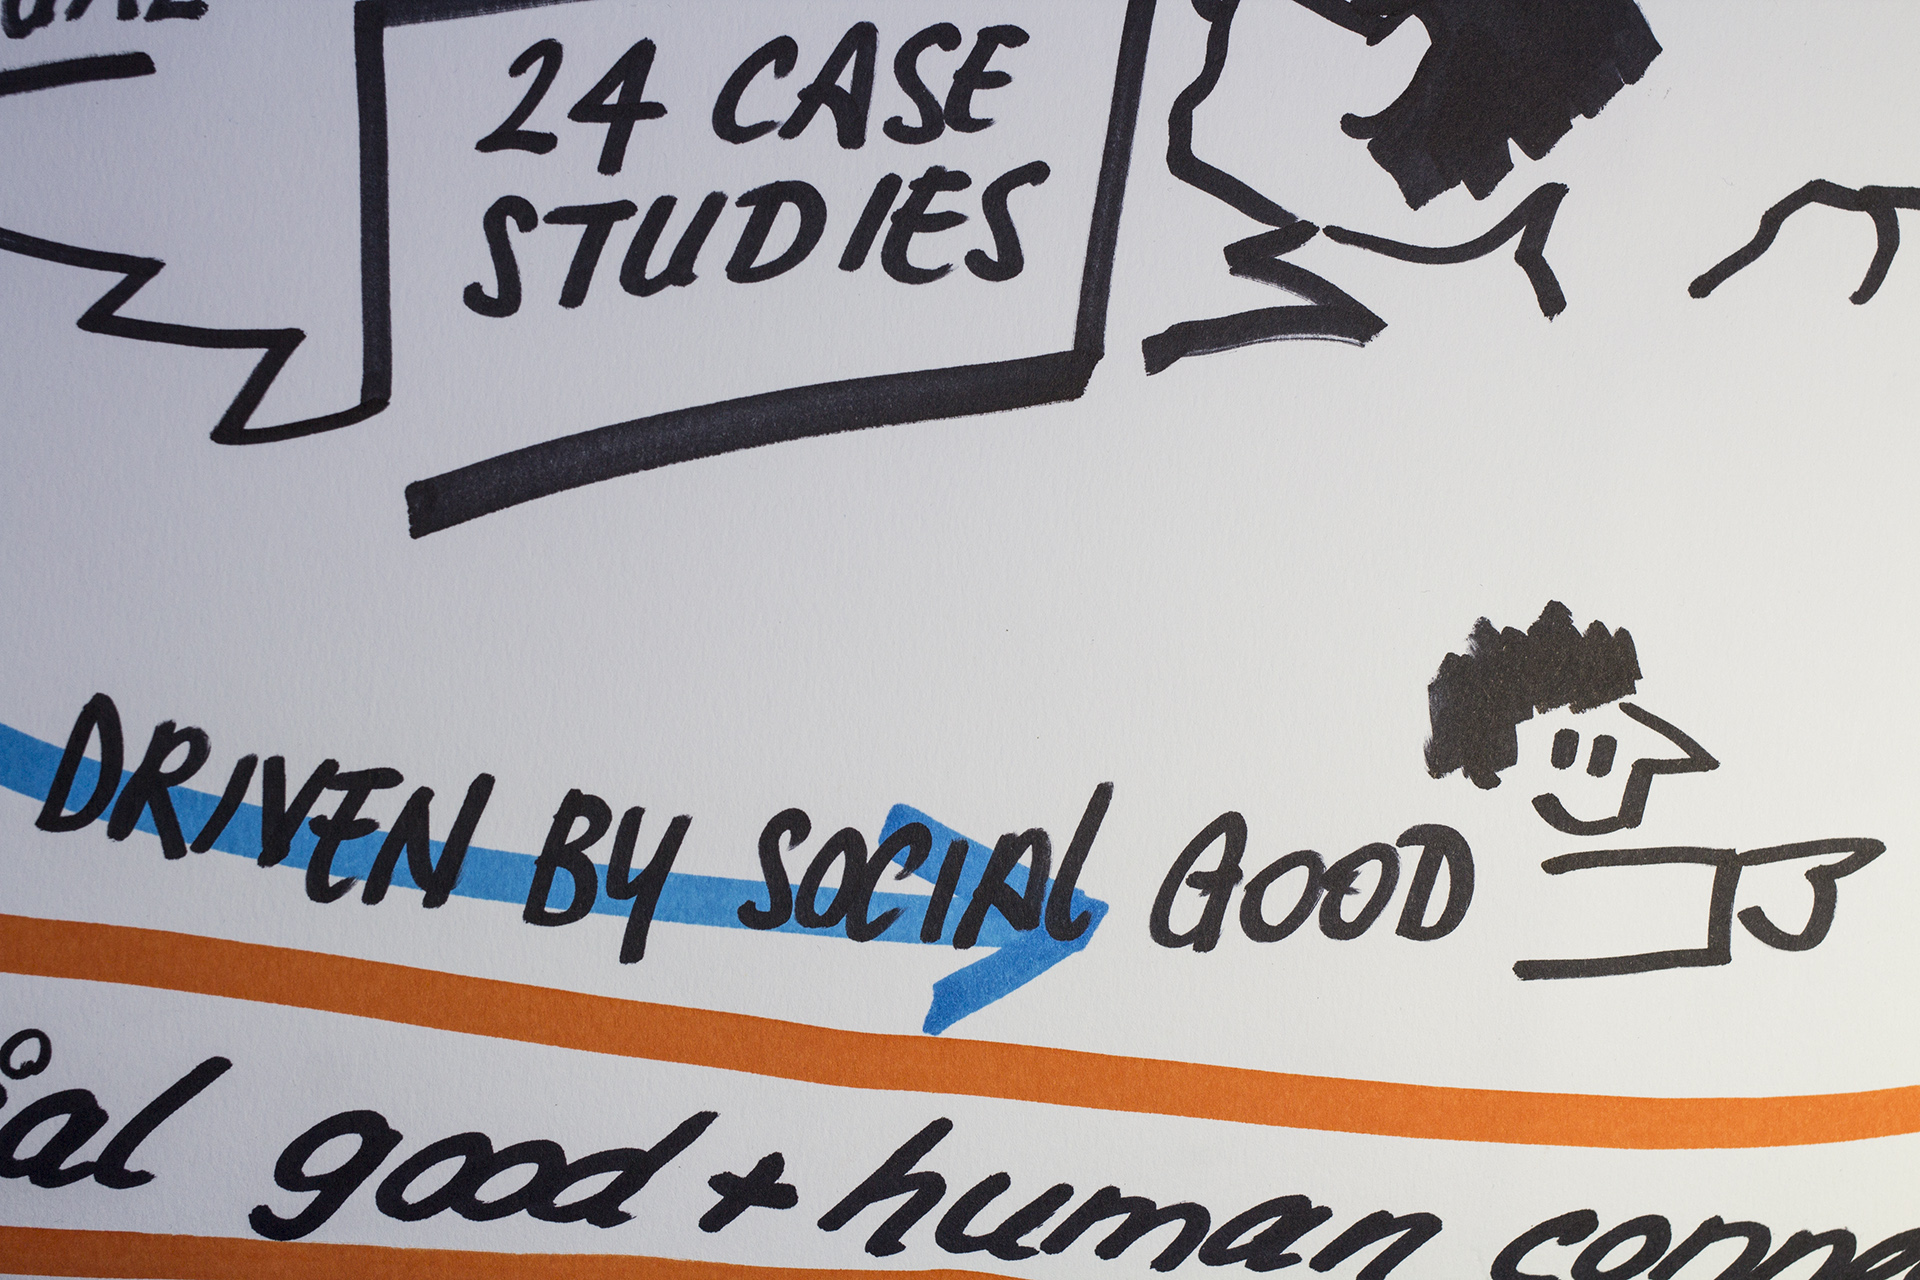 Paul Stacey about sustainability > CC + social good + human connection + $
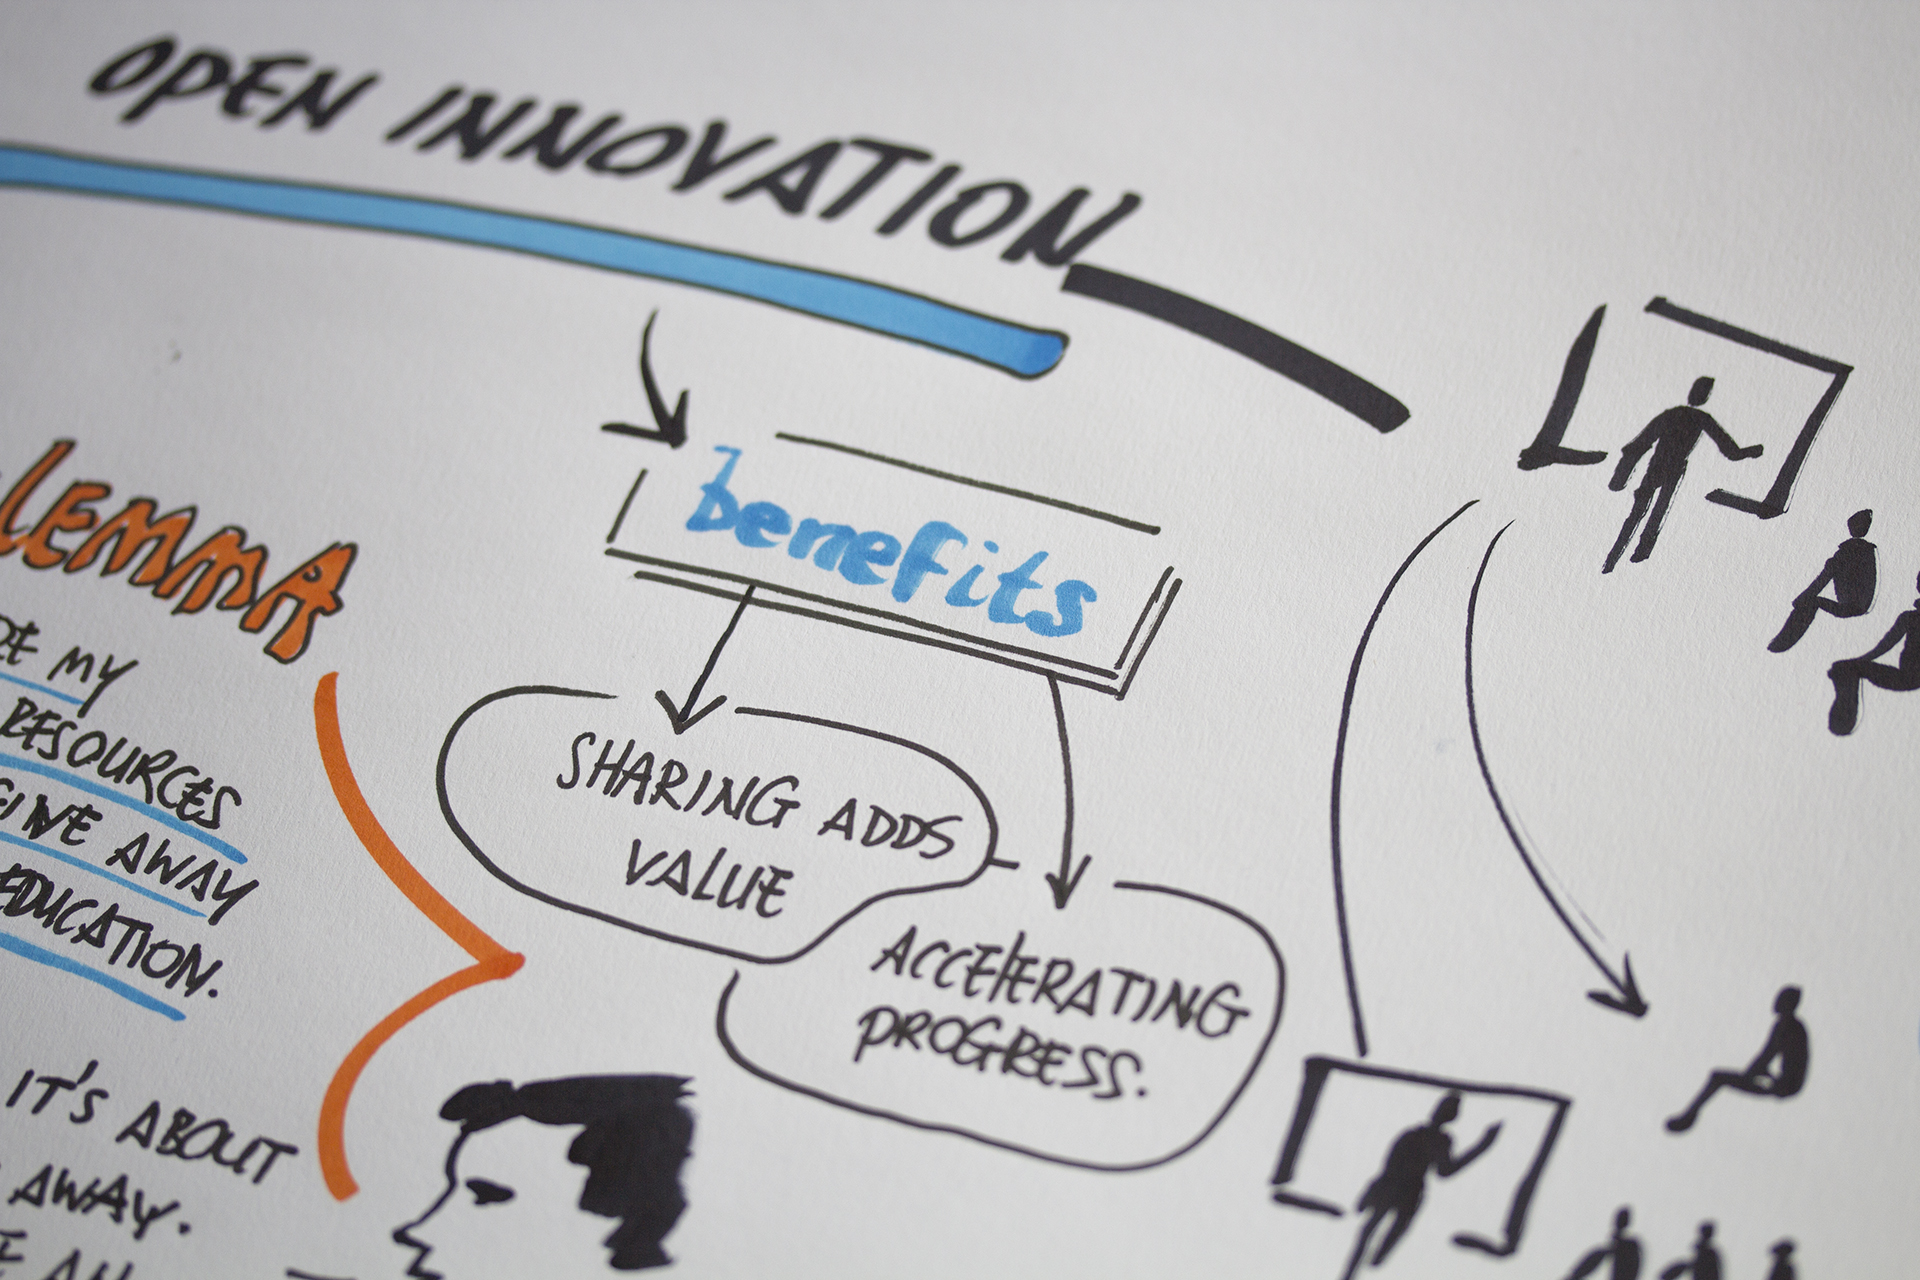
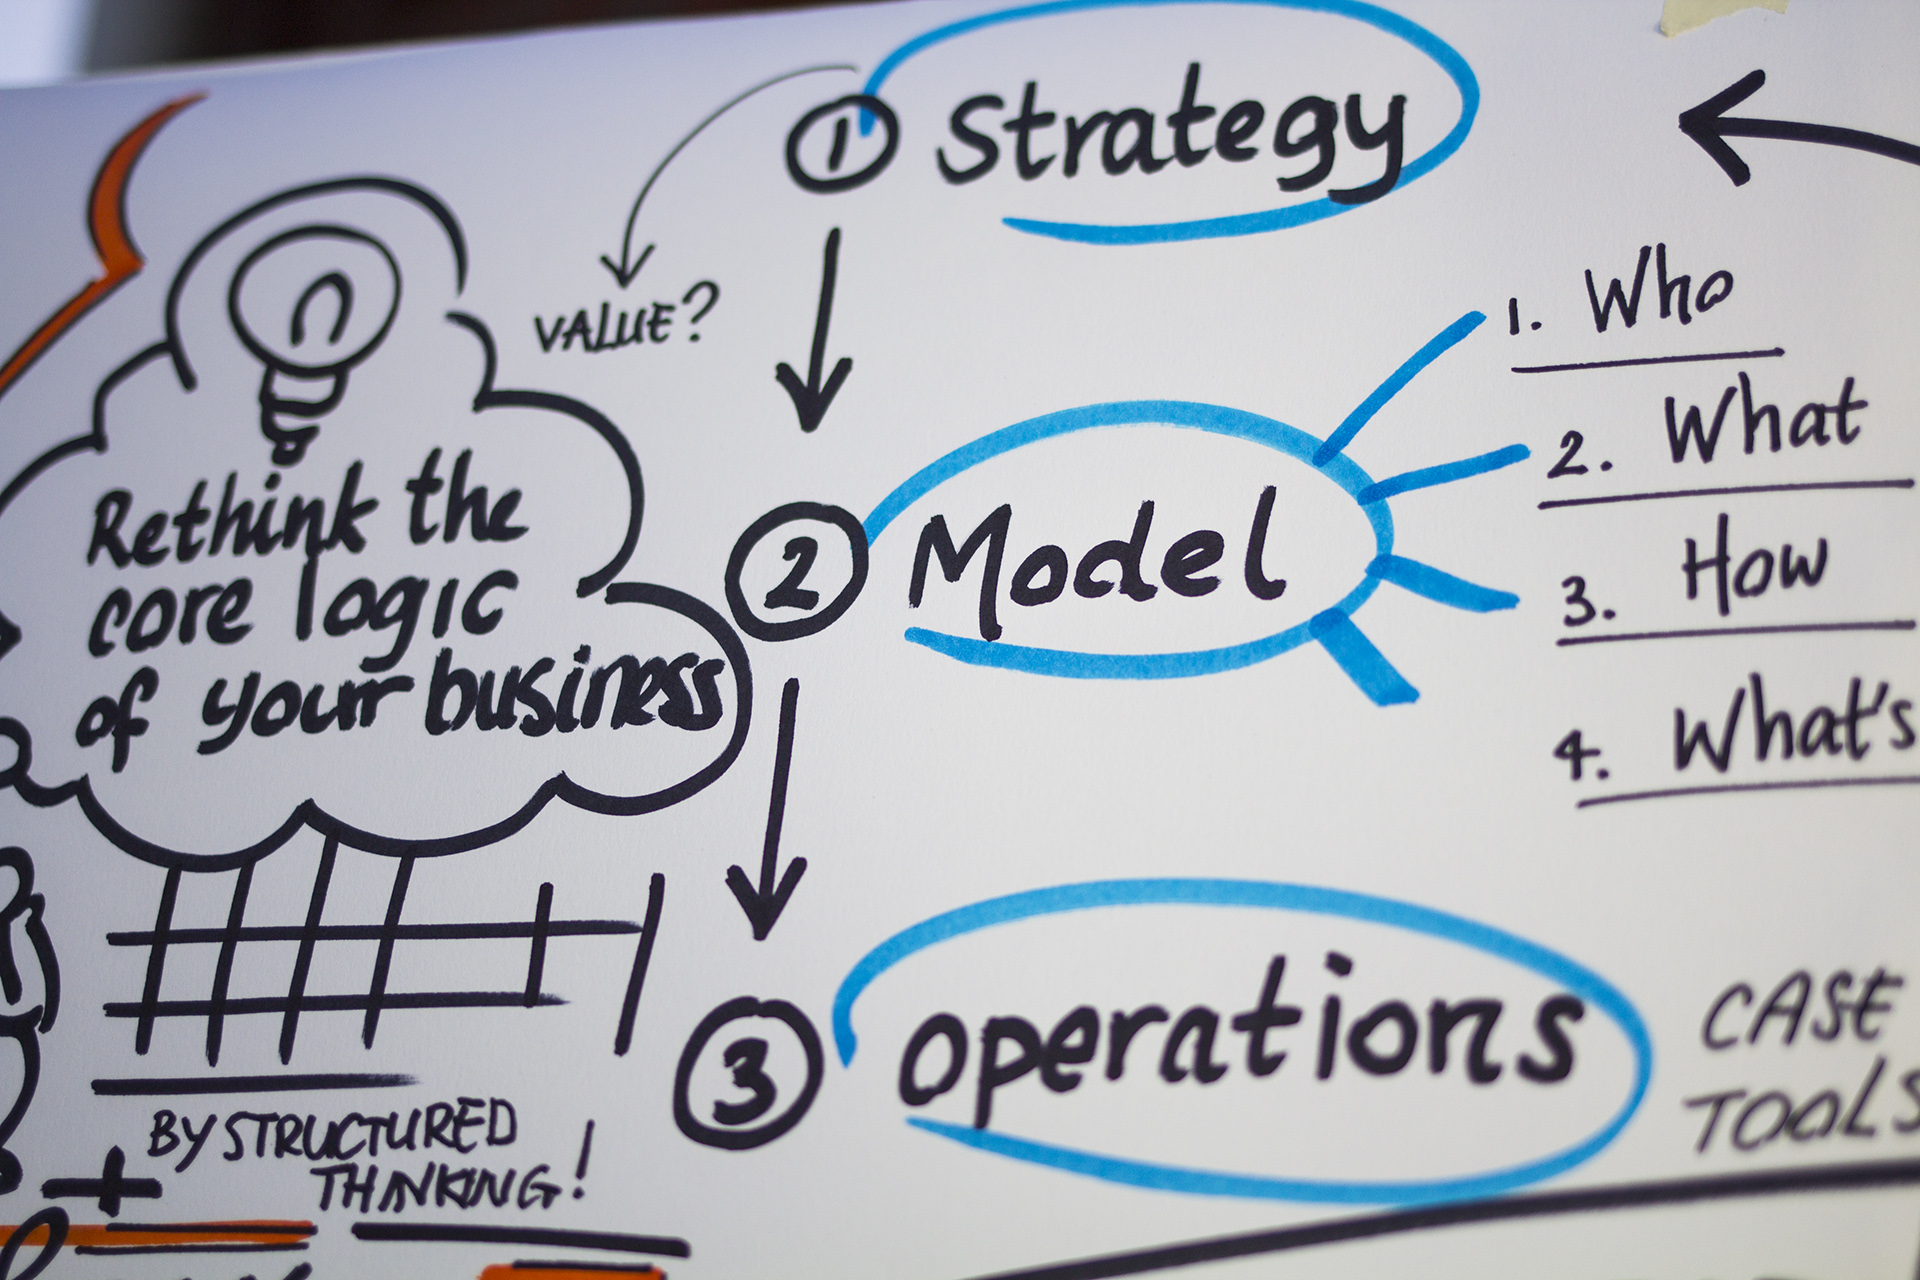 Mark de Reuver about innovation.
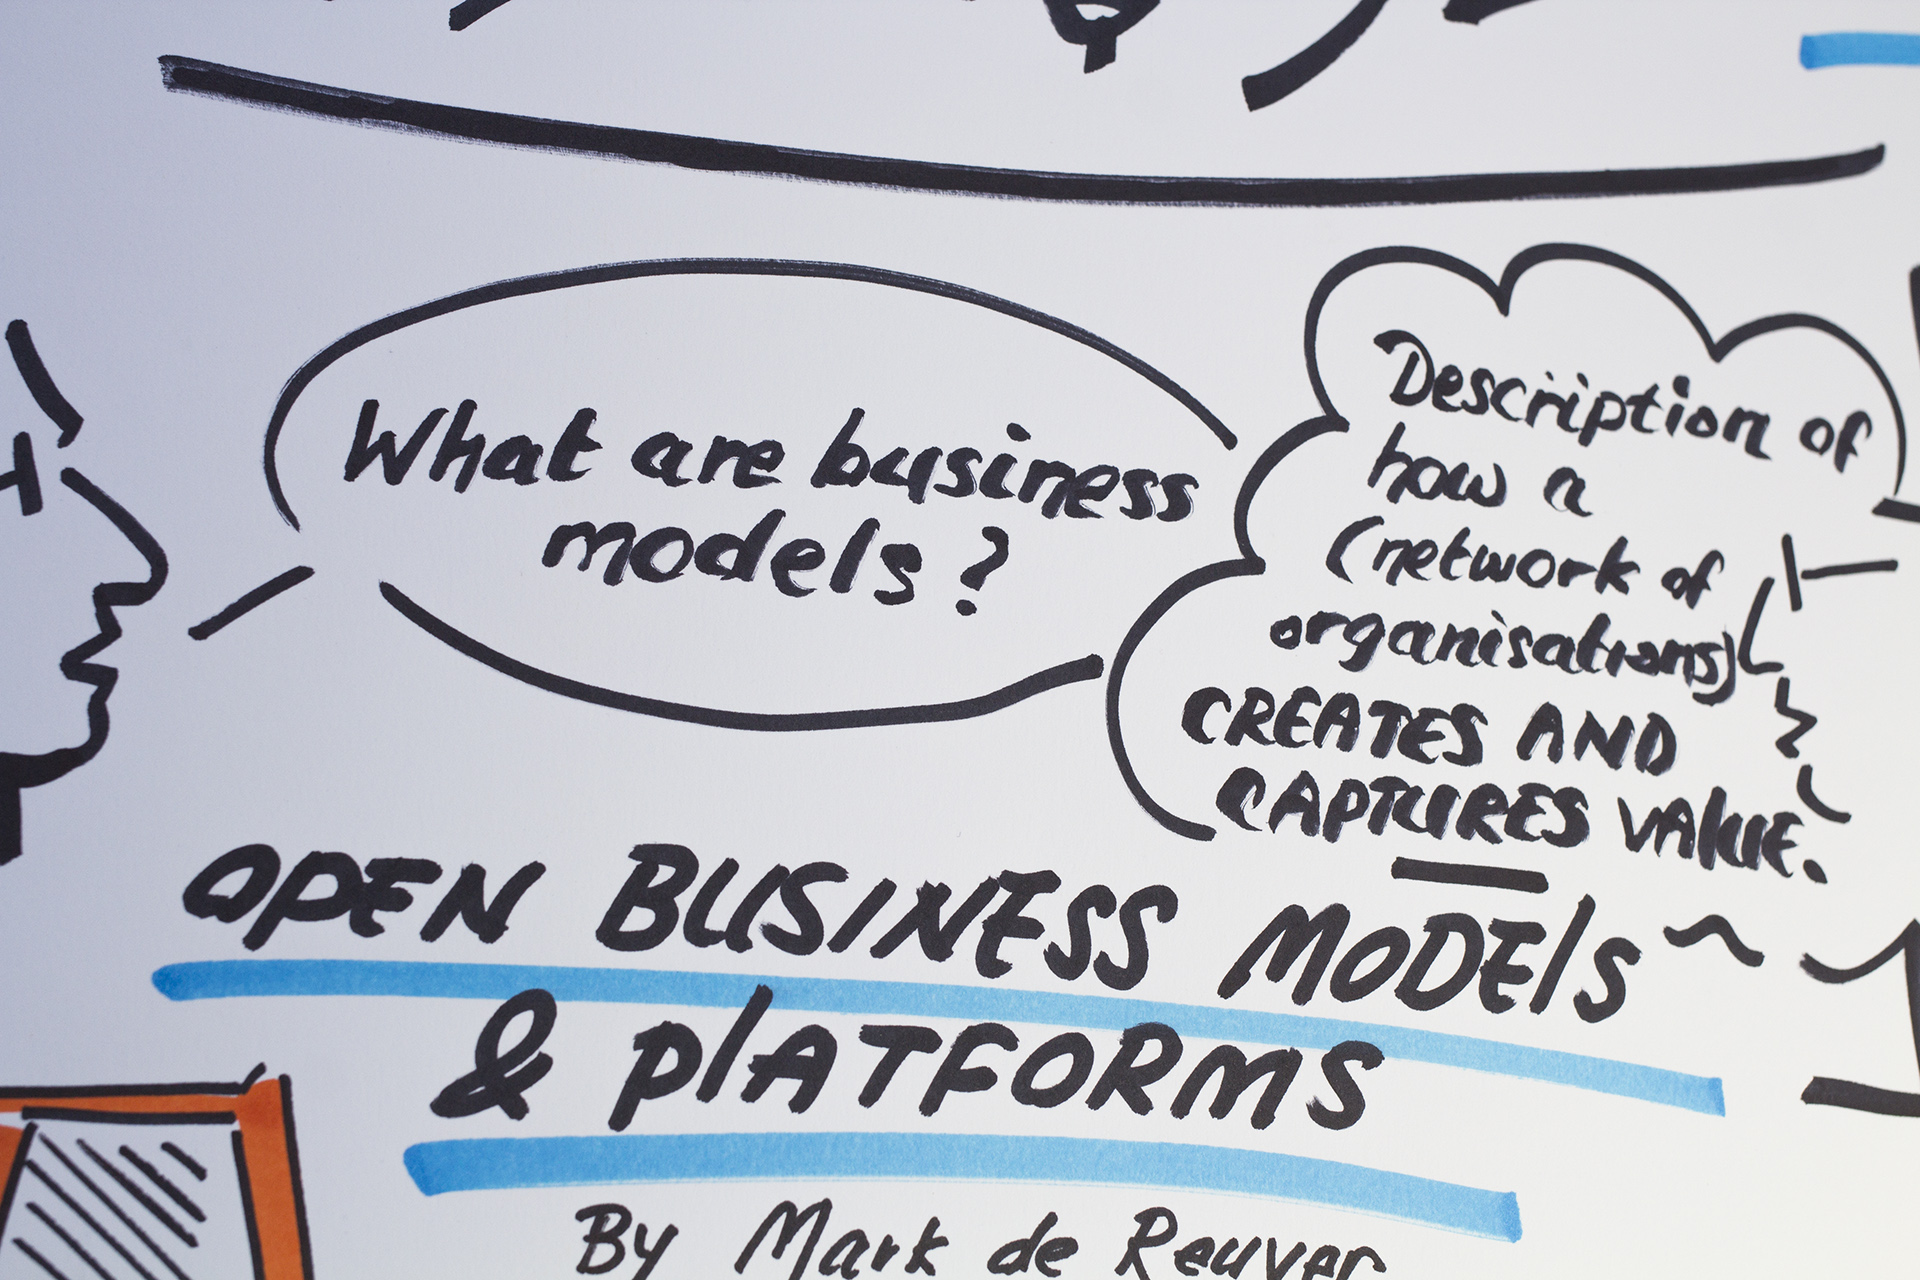 Mark de Reuver about business models and the Envision Project.
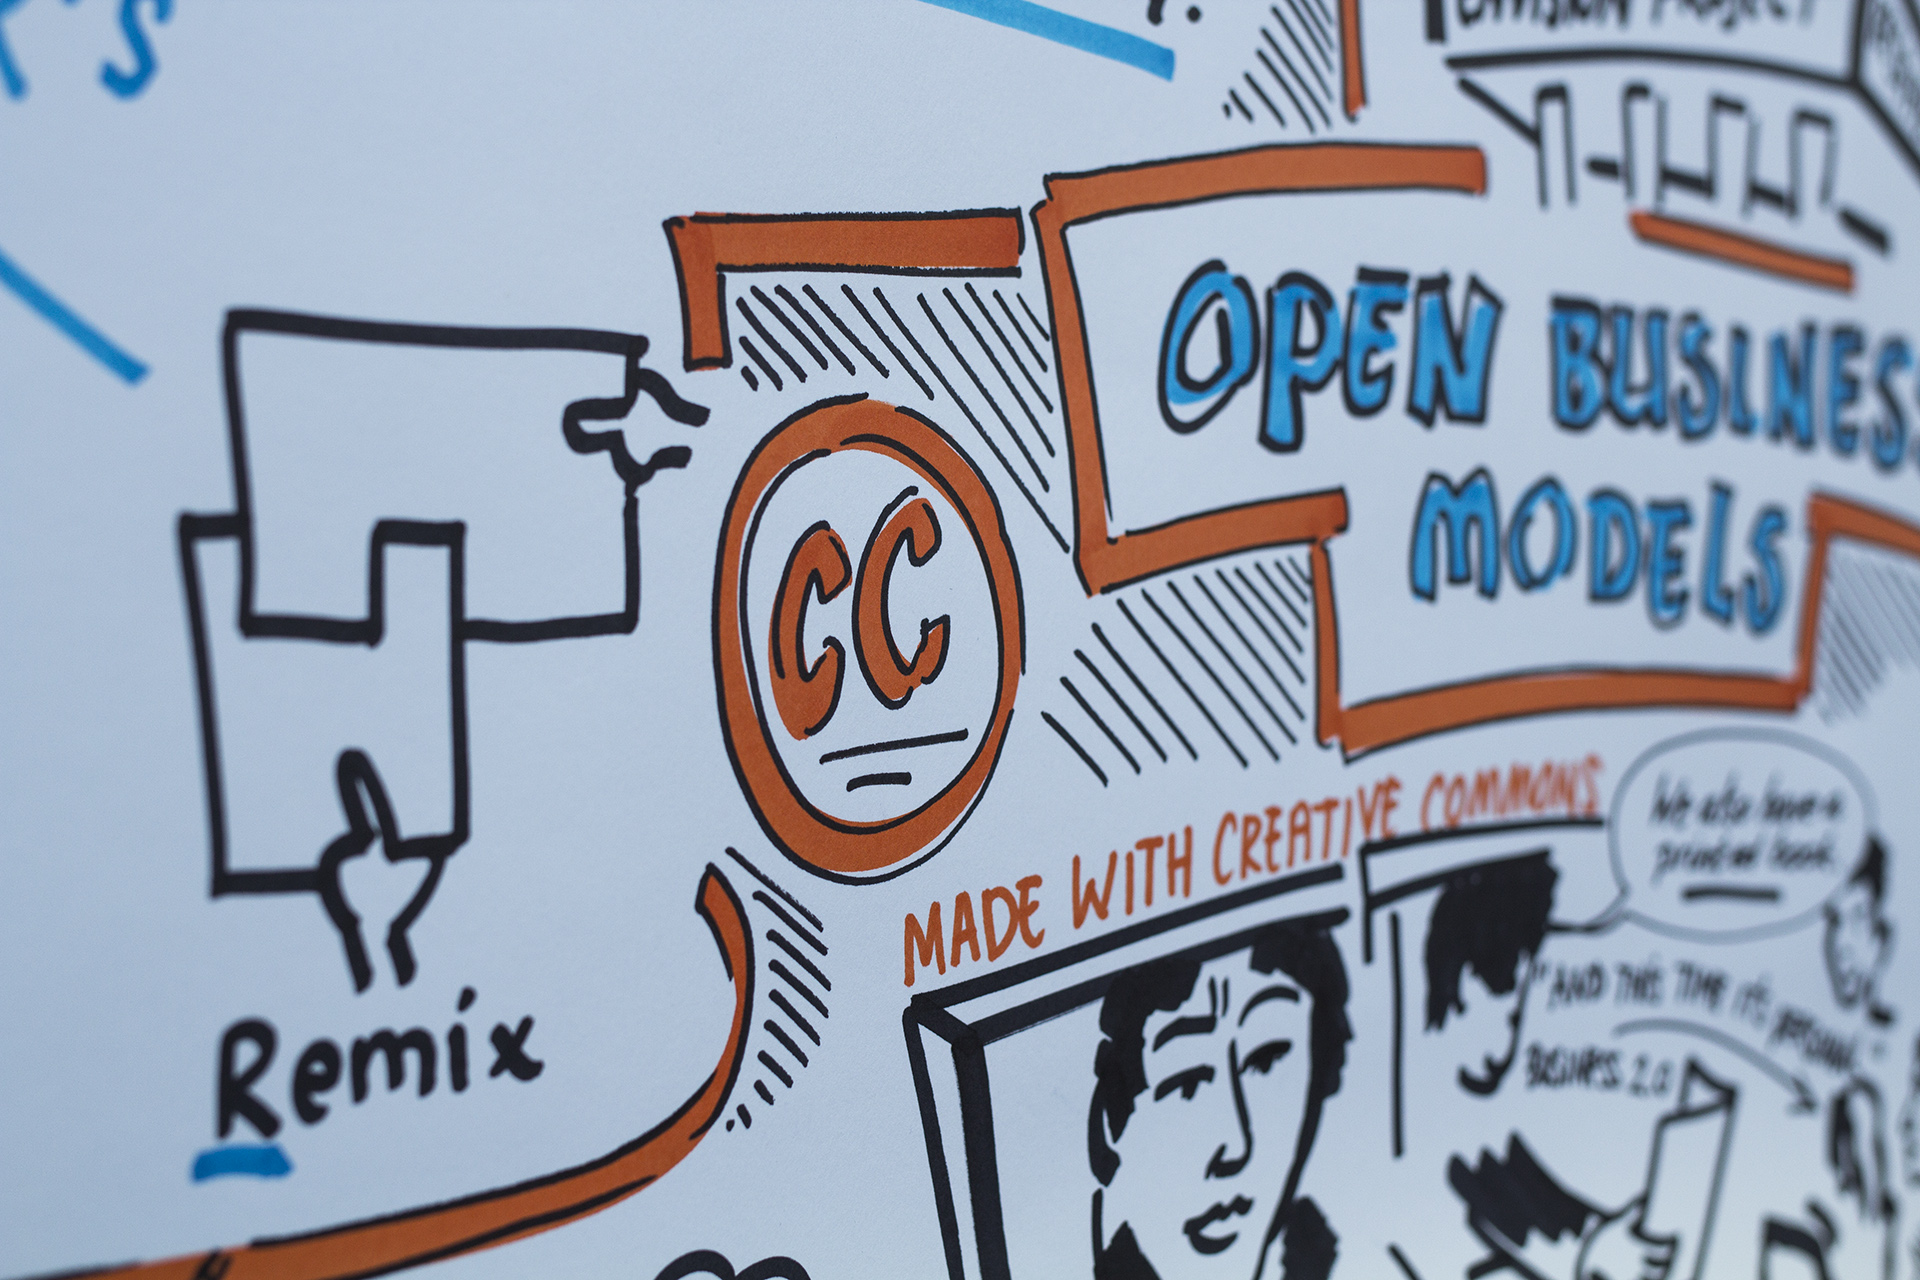 Willem van Valkenburg about openness and the 5 R’s: Remix, Retain, Reuse, Revise and Redistribute.
 Talking down the visual minutes at the Open Science Seminar March 31, 2017.
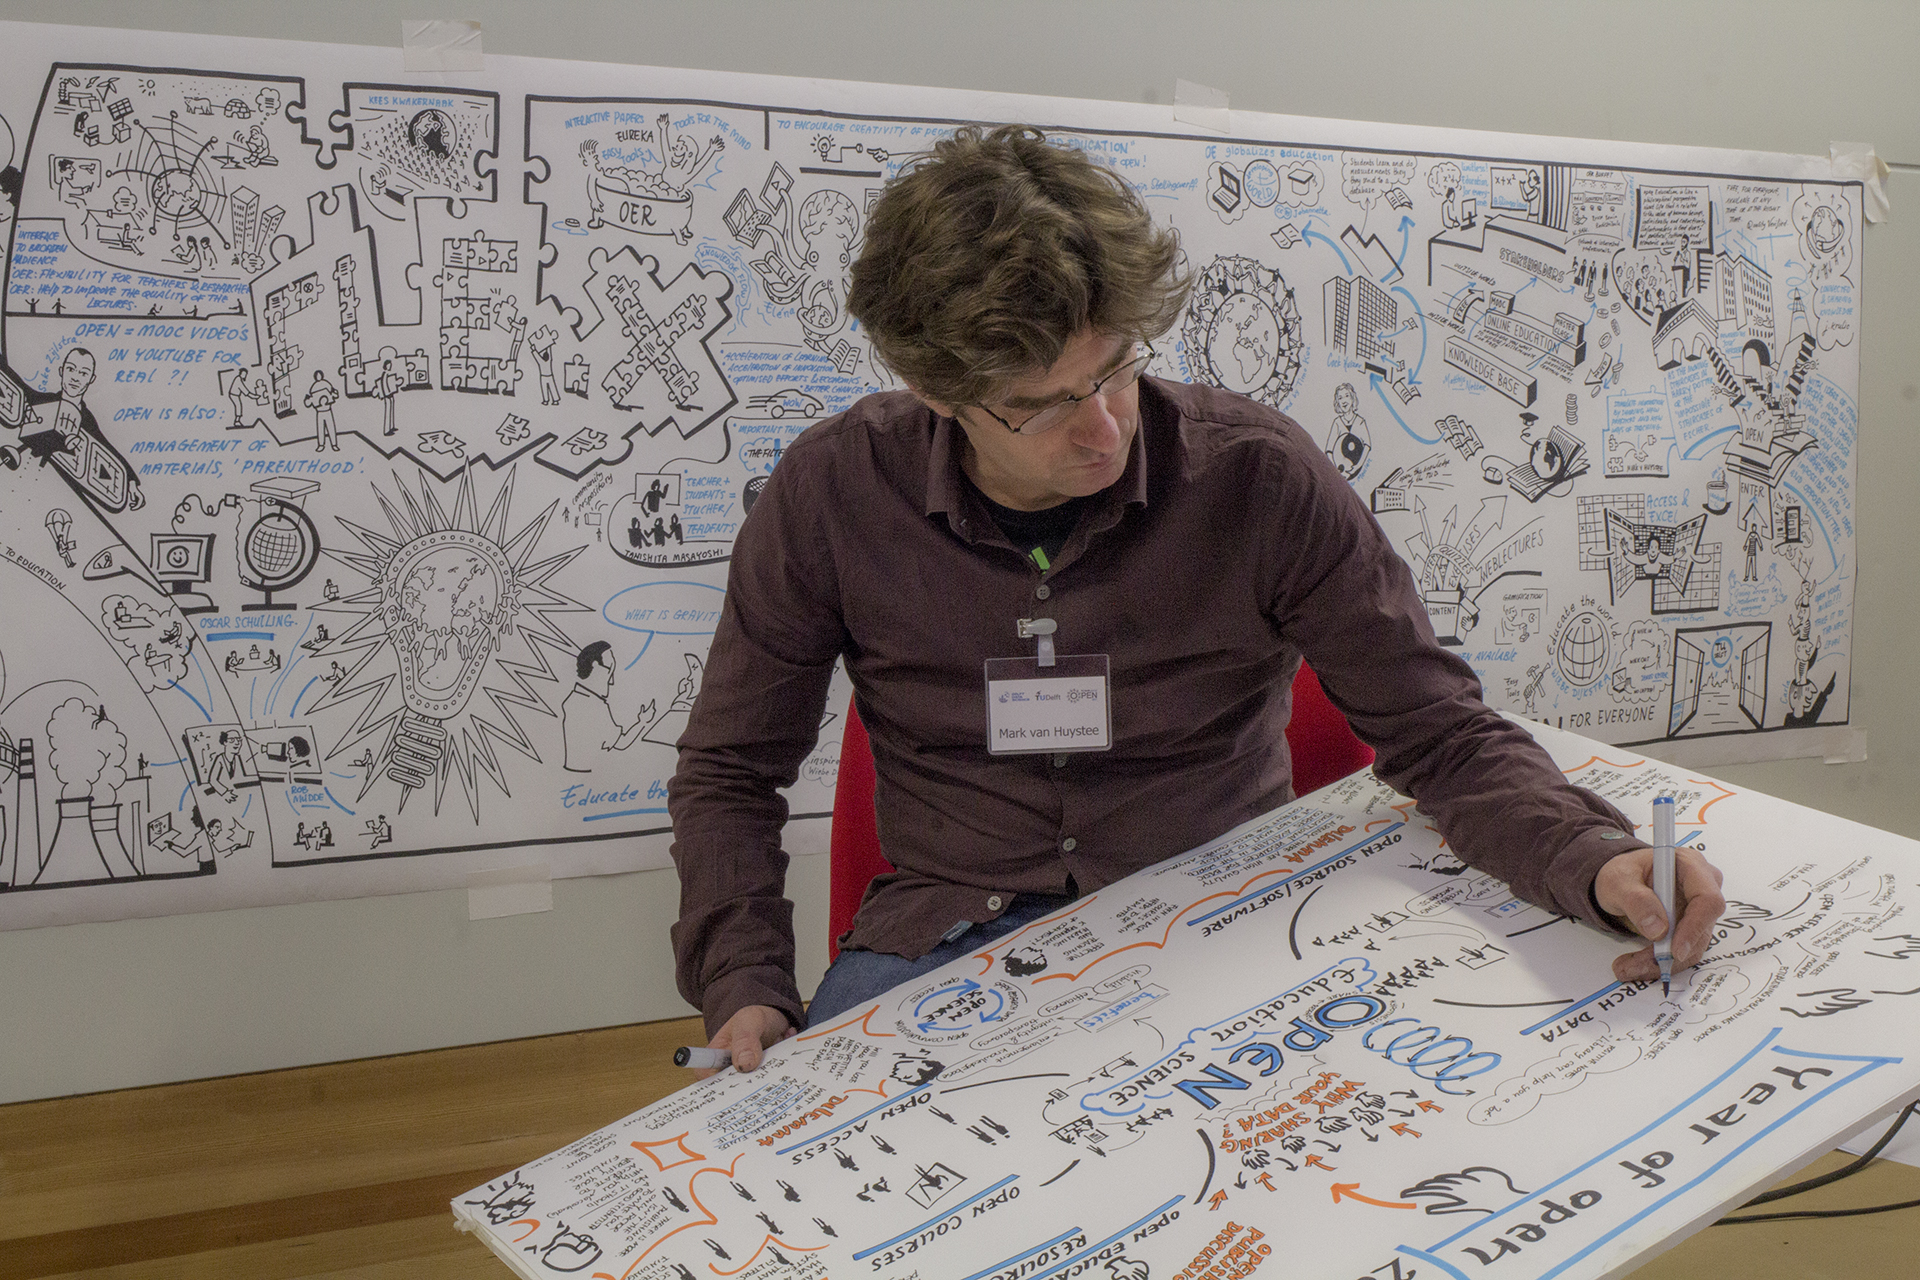
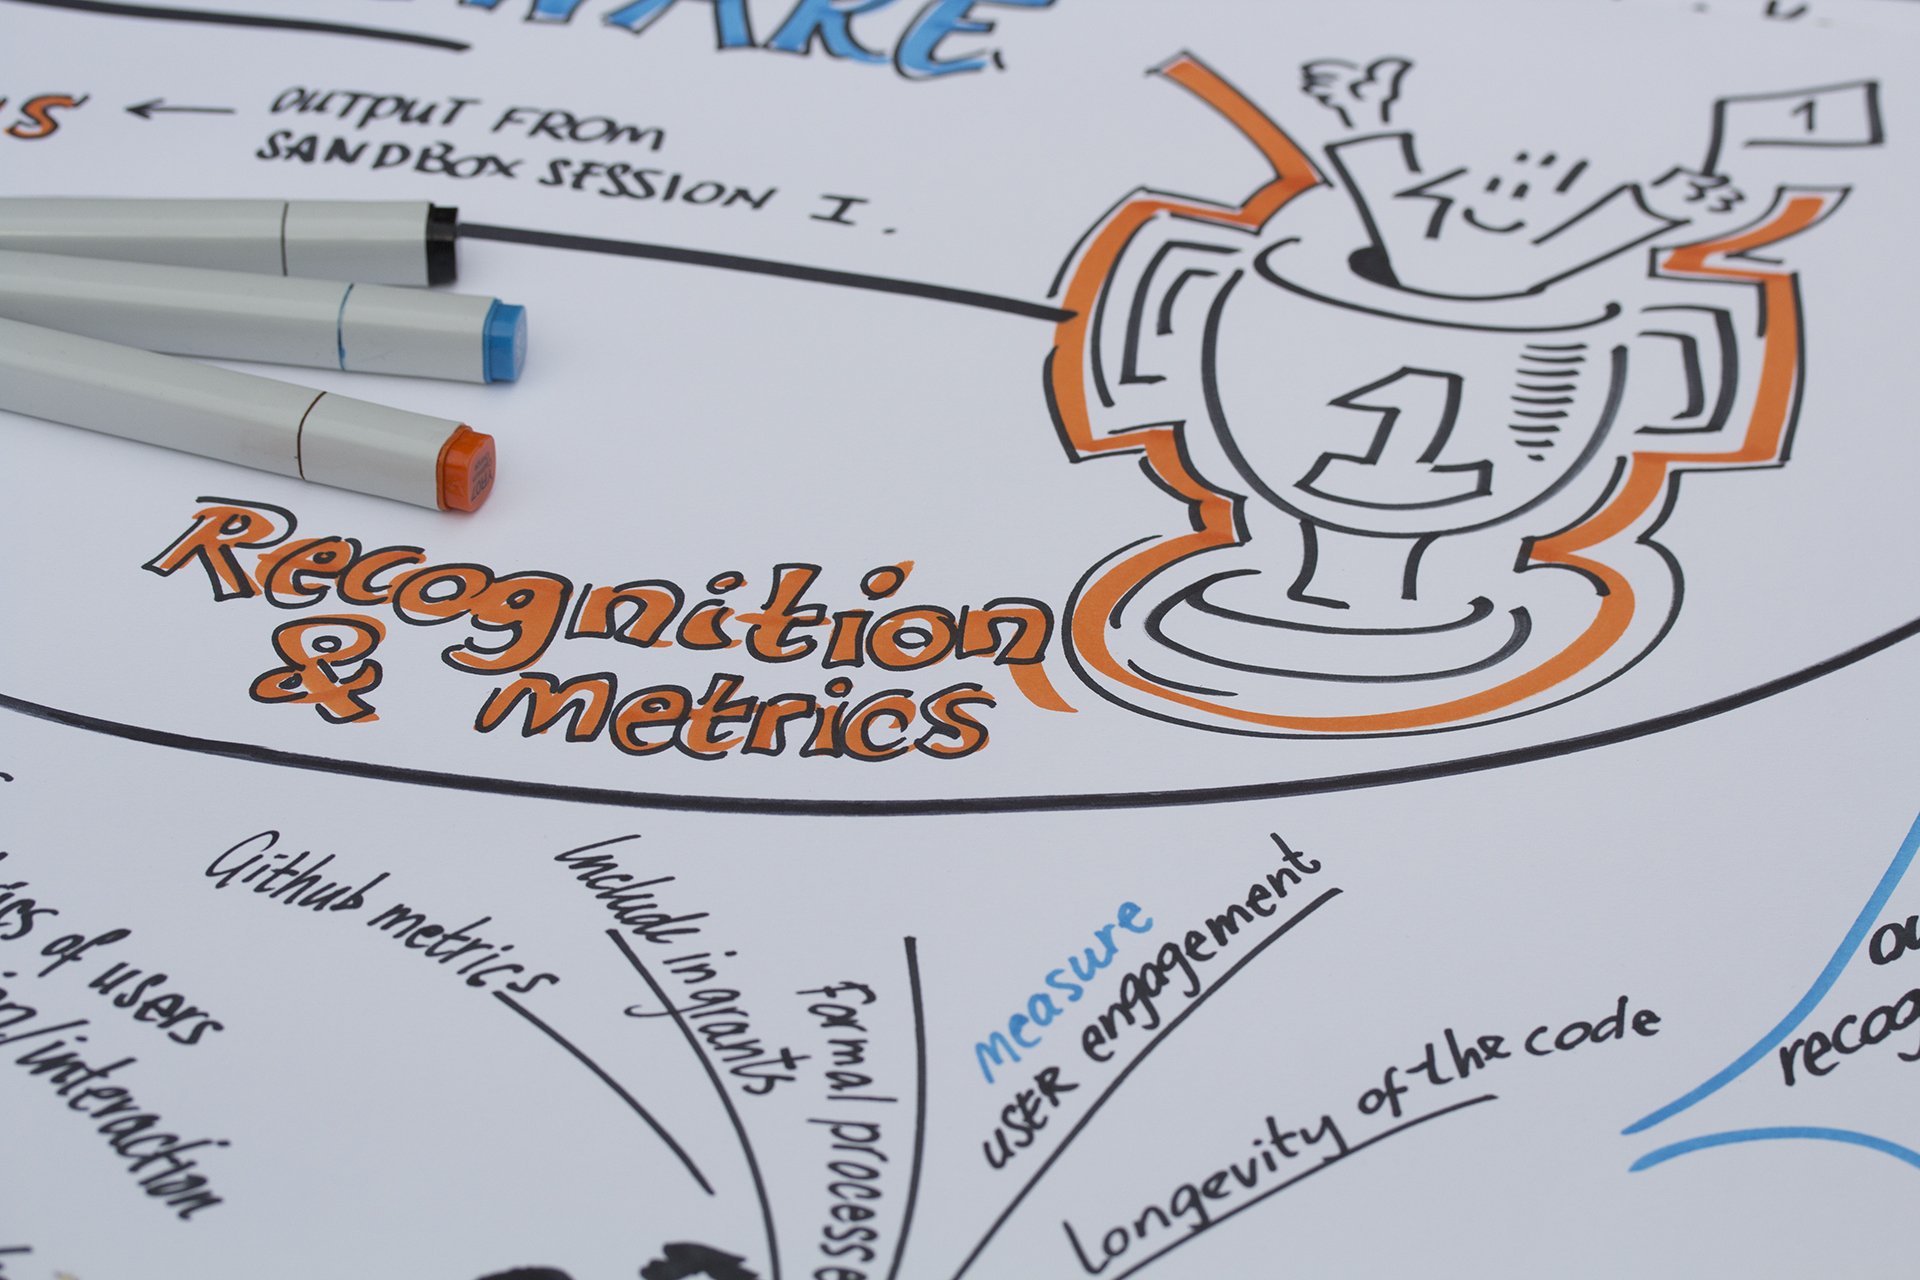
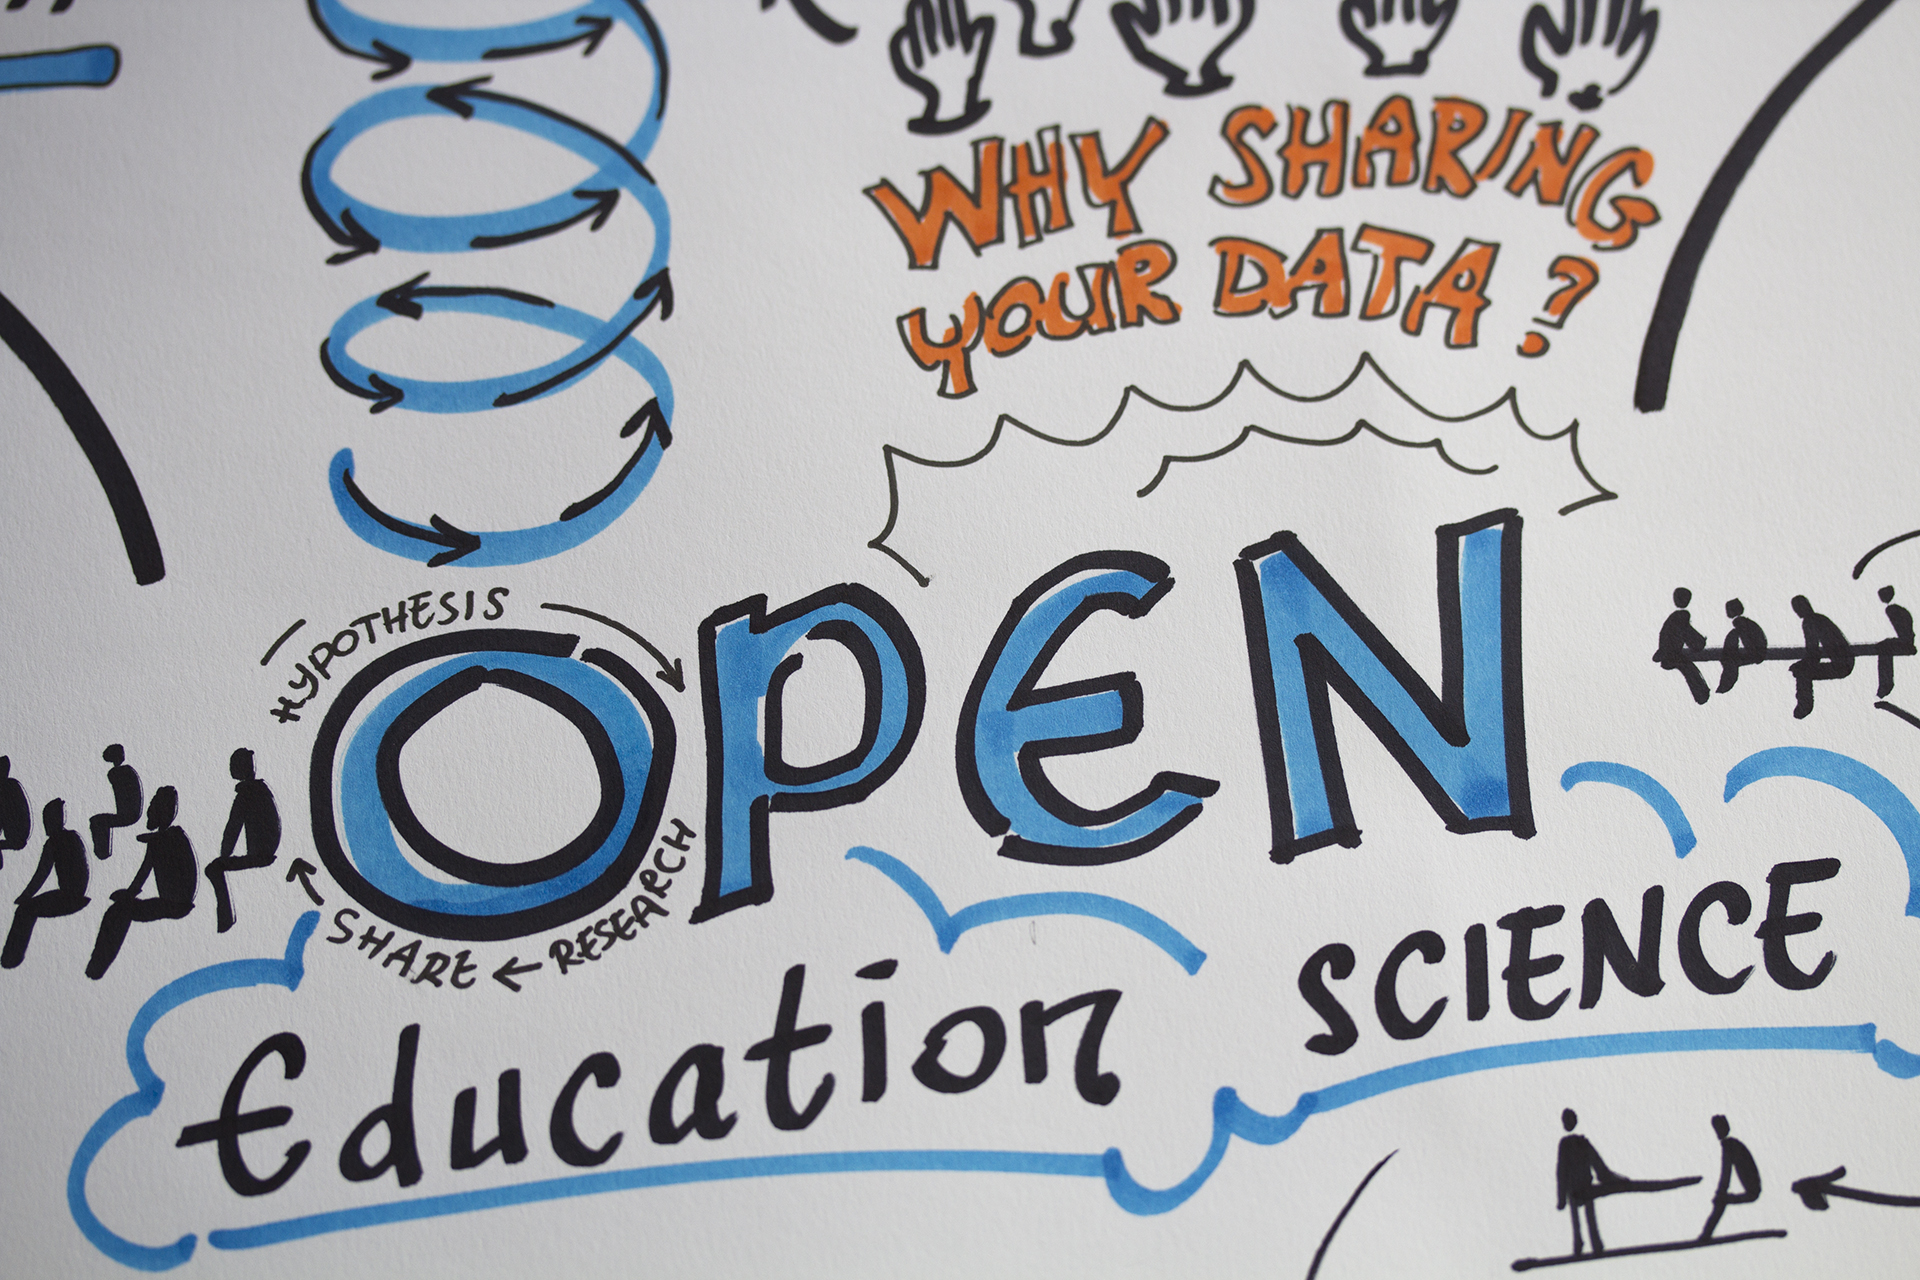 Central part of the visualization.